Blog

  • How Saudi Vision 2030 Became a Fly Ash Story

    How Saudi Vision 2030 Became a Fly Ash Story

    Saudi Arabia consumed 13.1 million metric tons of cement in the second quarter of 2025, up 21% year-on-year. The country is on track for approximately 78 million MT of annual cement demand by 2030 — driven by NEOM ($500 billion), the Red Sea Project, Qiddiya, Diriyah Gate, and a 600,000-home housing programme. Cement at that scale needs supplementary cementitious materials. Fly ash is the largest of those. This article explains why Vision 2030 has become a structural fly ash demand story, what the Class C / Class F distinction means for your sourcing decision, and how Au Club moves up to 1,000,000 MT per year of bulk fly ash into the Gulf.

    Market Snapshot
    13.1 Mt
    Saudi cement consumption Q2 2025
    +21%
    Cement demand year-on-year
    78 Mt
    Projected annual demand by 2030
    $500B
    NEOM headline investment

    What is driving Saudi cement demand to 78 million tonnes a year
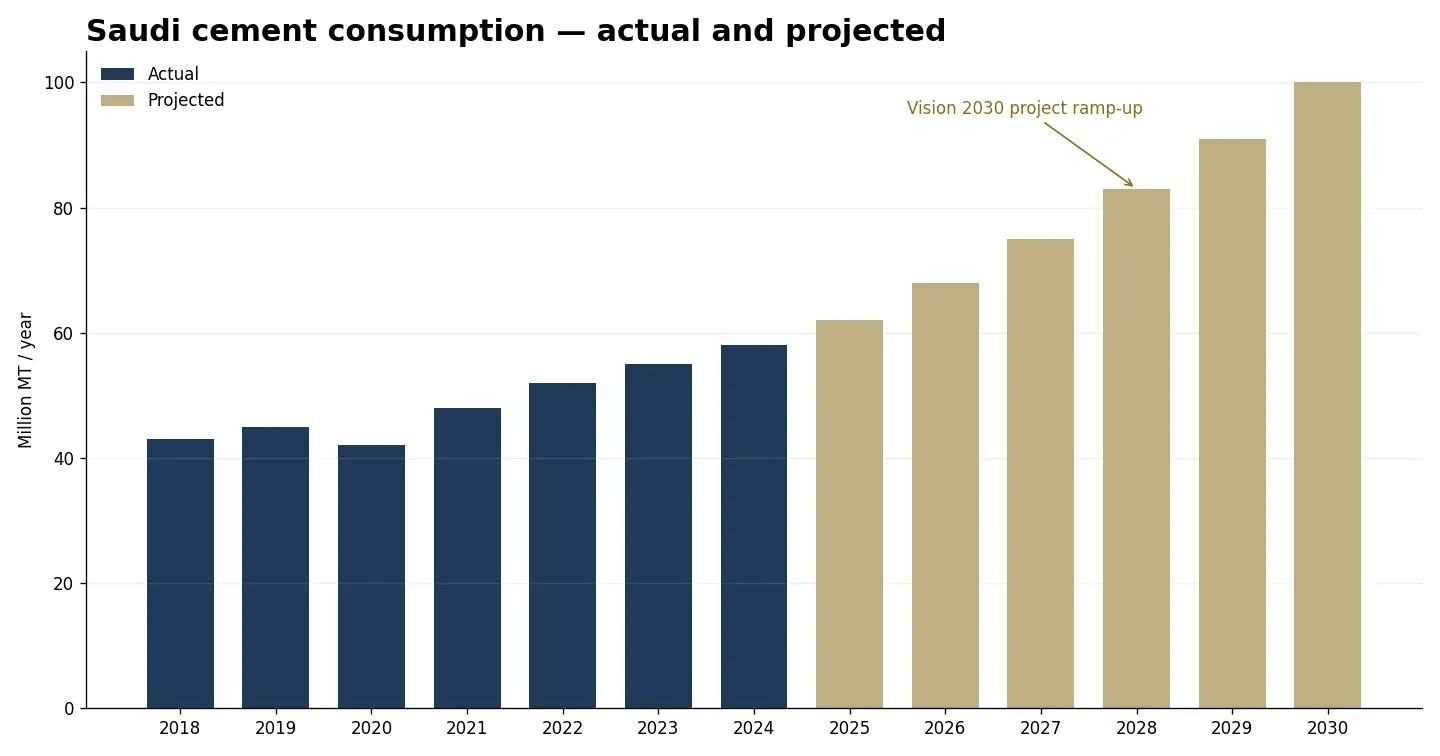
    Saudi cement consumption chart 2018 to 2030 projected with annotated milestones

    The Vision 2030 build-out is concrete-intensive at a scale not seen elsewhere in the world. The headline projects:

    • NEOM ($500bn). The Line (a linear city), Oxagon (industrial port city), Trojena (mountain resort), Sindalah (luxury island).
    • The Red Sea Project. 50 hotels, 8,000 hotel rooms, 1,300 residential properties across 22 islands.
    • Qiddiya. Entertainment city near Riyadh: theme parks, motorsport, water parks, residential.
    • Diriyah Gate. Heritage-adjacent mixed-use development west of Riyadh.
    • Roshn. State-backed residential developer building approximately 600,000 housing units by 2030.

    Saudi cement output in 2024 reached approximately 55 million MT. Industry consensus projects 78 million MT by 2030. Q2 2025 sales of 13.1 million MT — annualised, that is about 52 million MT — confirm the trajectory is on plan or modestly above.

    A cement-intensive economy that grows from 55 to 78 million MT in five years is not cyclical. It is structural. Cement producers, concrete suppliers, and supplementary cementitious material (SCM) traders are positioning for a multi-decade demand profile.

    Why fly ash specifically

    Fly ash is a coal-combustion by-product. Pulverised coal burned in power plant boilers leaves a fine glassy residue that, when mixed with portland cement and water, develops cementitious properties. Two practical reasons producers blend fly ash into concrete:

    1. Cost. Fly ash typically costs less than portland cement. Substituting 15-30% of cement with fly ash reduces concrete cost per cubic metre.
    2. Carbon. Each ton of portland cement embodies approximately 0.8 ton of CO₂ from calcination and fuel use. Fly ash has zero embodied carbon in the cement substitution role — it would otherwise be landfilled. NEOM and other Vision 2030 projects increasingly specify low-carbon concrete.

    In January 2025 the NovusCrete Consortium — Public Investment Fund, NEOM, and other partners — was formed to develop sustainable concrete solutions specifically for giga-projects. Low-carbon concrete with significant SCM content is the working specification.

    Beyond NEOM, the wider Saudi cement industry is pulled toward SCM use by carbon-pricing pressure (KSA is exploring an emissions trading scheme) and by international supply chain customers (LEED, BREEAM, and EDGE certifications all reward low-carbon concrete).

    Class C vs Class F — the specification distinction
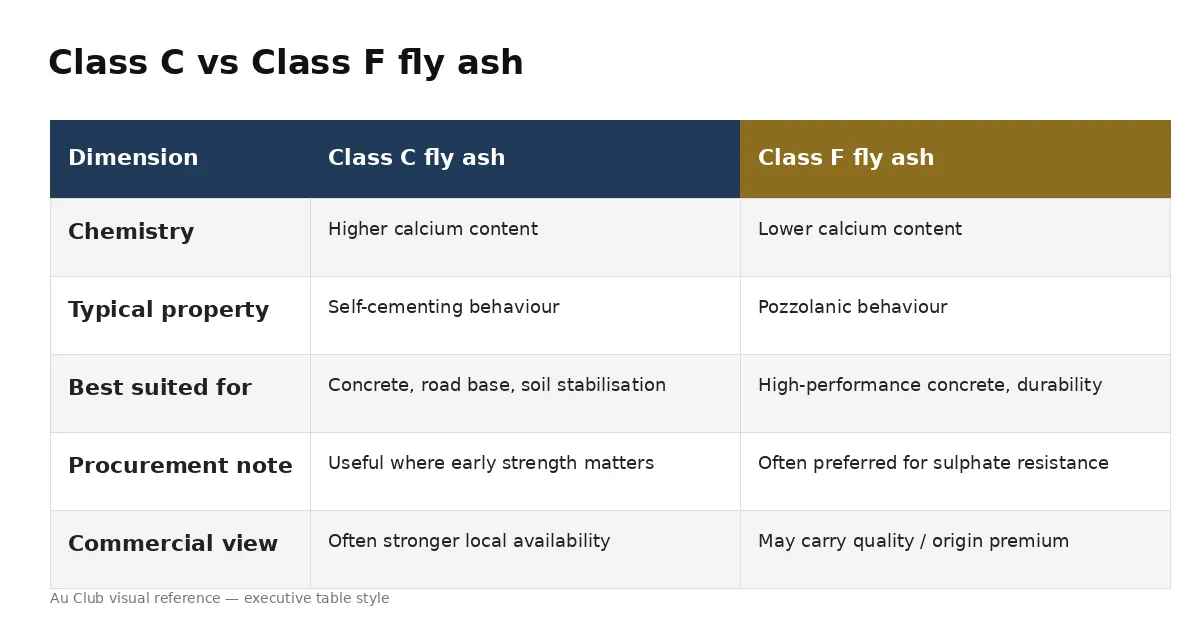
    Comparison of Class C and Class F fly ash by chemistry, properties, applications

    Fly ash sold globally is classified primarily under ASTM C618. Two grades dominate:

    Property

    Class C

    Class F

    Source coal

    Sub-bituminous, lignite

    Anthracite, bituminous

    SiO₂ + Al₂O₃ + Fe₂O₃ (sum)

    ≥ 50%

    ≥ 70%

    CaO content

    Higher (typically 15-35%)

    Lower (typically <10%)

    Self-cementing

    Yes (some)

    No

    Typical applications

    Standard concrete

    High-performance concrete, sulfate-resistant

    Loss on ignition (LOI)

    ≤ 6%

    ≤ 6%

    Class C has higher calcium content. It has some self-cementing properties and can be used at higher replacement ratios in some applications. It is the workhorse for general-purpose concrete.

    Class F is the high-performance specification. Its higher silica/alumina/iron content provides better long-term strength, lower permeability, and better resistance to sulfate attack and alkali-silica reaction. It is the specification for marine concrete (Red Sea Project), high-strength applications, and tunnel-lining concrete (NEOM has extensive tunnelling).

    Most NEOM, Red Sea Project, and Qiddiya specifications call for Class F. Roshn housing typically uses Class C. A trader supplying the full Vision 2030 portfolio needs reliable origins for both.

    The four working origins
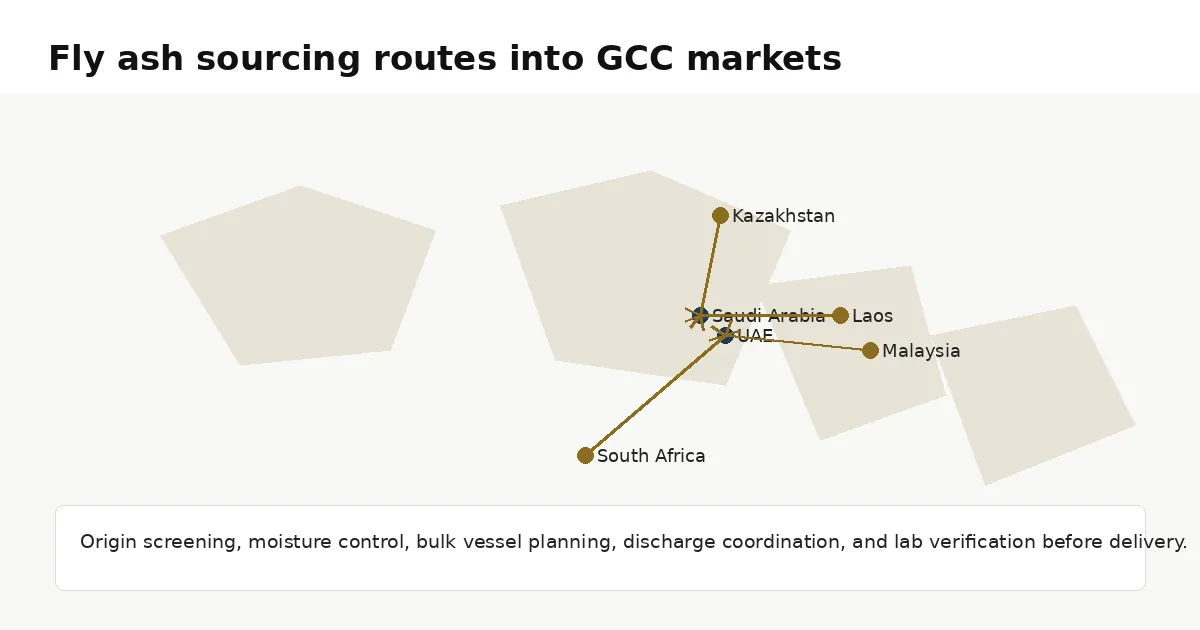
    World map of fly ash origins (Laos, Malaysia, Kazakhstan, South Africa) flowing to Saudi Arabia

    Au Club sources bulk fly ash from four primary origins. Each has its profile:

    Laos

    Class C and Class F available. Several Lao coal-fired power stations produce export-grade fly ash. Logistics: trucked to Vientiane or Pakse, river barge to Vietnam ports (Hai Phong, Vung Tau) for ocean shipment. Vessel sizing typically Handysize. Moisture spec is the key control point.

    Malaysia

    Class C predominant. Tanjung Bin and Manjung power stations are the largest sources. FOB Port Klang or Tanjung Pelepas. Vessel sizing Handysize to Supramax. Reliable supply chain. Most accessible quality control.

    Kazakhstan

    Class F predominant. Ekibastuz and Pavlodar coal complexes generate large fly ash volumes. Land transport via rail to Caspian ports (Aktau) or to Black Sea ports (via Russia, with sanction-related complications). For Gulf delivery, the routing is typically rail to Iranian transit ports — which complicates US-buyer documentation. Most Au Club Kazakh ash goes to Gulf and Mediterranean buyers who do not have US-nexus issues.

    South Africa

    Class F predominant. Eskom power stations (Lethabo, Matla, Kendal, Majuba) produce significant export volumes. FOB Richards Bay or Durban. Vessel sizing Supramax to Panamax. Established quality control. Au Club’s largest single-origin volume for Gulf delivery.

    Origin

    Class

    Typical FOB port

    Vessel size

    Moisture spec

    Lead time to Jebel Ali

    Laos

    Class C / F

    Hai Phong, Vung Tau

    Handysize

    <12%

    25-35 days

    Malaysia

    Class C

    Port Klang

    Handysize-Supramax

    <10%

    20-25 days

    Kazakhstan

    Class F

    Aktau, Bandar Abbas

    Handysize

    <10%

    30-40 days

    South Africa

    Class F

    Richards Bay, Durban

    Supramax-Panamax

    <8%

    20-25 days

    Logistics reality — what changes the price-per-MT delivered
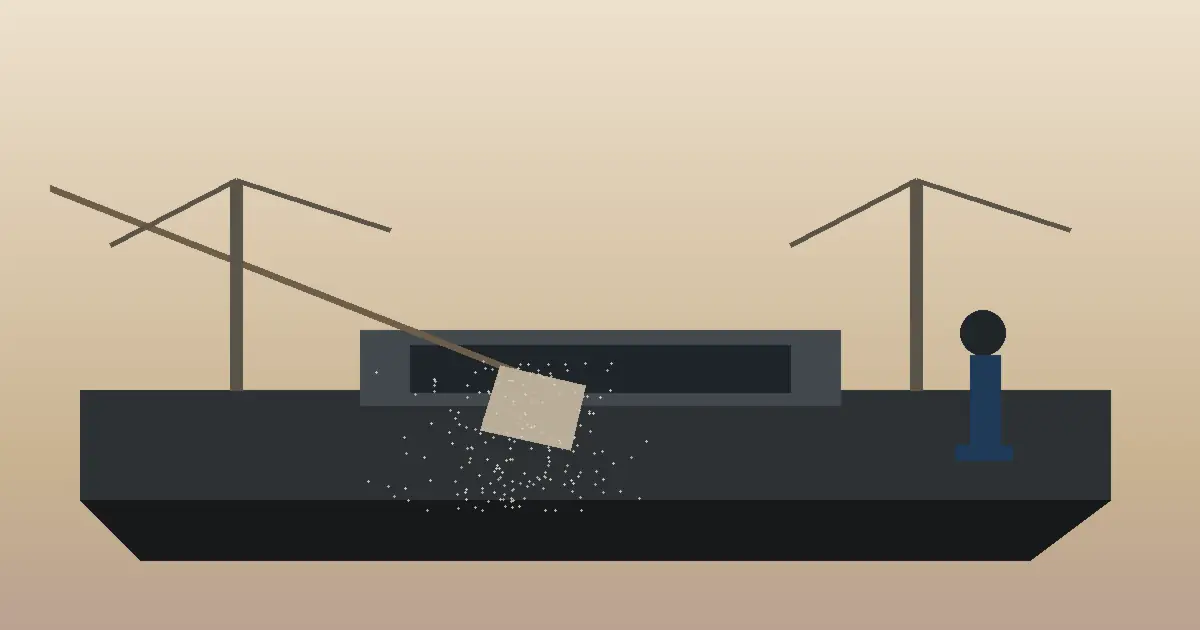
    Bulk fly ash being loaded onto vessel via port conveyor

    Three practical issues that affect landed cost:

    Moisture. Fly ash is hygroscopic. A 12% moisture cargo behaves and handles differently than an 8% moisture cargo. Cement producers specify maximum moisture (usually 8-10%). Above-spec moisture means rejection or steep penalties. Vessels carrying fly ash need closed cargo holds with adequate ventilation.

    Vessel handling. Bulk fly ash is loaded by conveyor and discharged either by pneumatic suction or by grab. Pneumatic discharge is cleaner and faster but requires specific vessel and port equipment. Many Gulf cement plant discharge facilities prefer pneumatic. The wrong vessel adds discharge cost and time.

    Port storage. Jebel Ali, Jeddah, and King Abdullah Port have bulk handling capacity but limited dedicated fly ash storage. Cement plants typically run silo-to-vessel chartering — meaning vessel scheduling matters more than spot inventory. A reliable supply partner manages the silo-fill cycle, not just the shipment.

    How an Au Club fly ash contract is structured

    Standard contract terms for a precast or RMC producer in the Gulf:

    • Volume. Annual offtake commitment, with monthly schedule. Up to 1,000,000 MT/year supported across multiple origins.
    • Specification. ASTM C618 Class C or F. Specific limits on LOI (≤6%), moisture (≤10% at loading, ≤8% on arrival if specified), residue on 45-micron sieve (≤34%).
    • Inspection. SGS or Intertek at loading port and discharge port. Loading certificate includes COA, certificate of origin, moisture certificate.
    • Price formula. Most contracts use a CFR Jebel Ali / CFR Jeddah base price, with freight component floating against Baltic Supramax or Handysize index. Some buyers prefer fixed CFR for budget certainty.
    • Payment. LC at sight, or 30/60/90 day deferred LC. TT against pre-shipment documents for established buyers.
    • Force majeure. Includes adverse weather at loading, port closure, and origin-country export licence issues.

    Au Club’s read on 2025-2030 fly ash demand

    Three working assumptions:

    1. Saudi cement demand reaches 70-80 million MT annually by 2030. The trajectory is consistent across forecaster sources. Vision 2030 is not slowing.
    2. SCM content in giga-project concrete specifications averages 25-35%. Higher in marine and high-strength applications. Lower in routine residential.
    3. Class F fly ash is the binding supply constraint. South African and Kazakh origins will be sold forward through 2030 within the next 12-18 months.

    For cement producers and ready-mix suppliers: lock 2026-2028 supply now. Spot pricing in 2027-2028 will reflect the demand surge. Multi-year contracts at today’s price levels are the strategic move.

    FAQs

    Is fly ash production declining as coal-fired power is phased out?

    Globally, yes — slowly. But coal capacity in Laos, Indonesia, Malaysia, Vietnam, Kazakhstan, and South Africa is not declining at the pace of OECD coal. Working supply for the next 10-15 years is well-established.

    What is the difference between Class C and Class F fly ash?

    Class C has higher calcium content and some self-cementing properties. Class F has higher silica/alumina/iron content and better high-performance characteristics. Most NEOM and Red Sea Project specifications call for Class F.

    How much fly ash can replace cement in a mix?

    Typical replacement ratios run 15-30%. Some high-performance and mass concrete applications use 40-50%. The maximum is determined by structural performance requirements, curing time, and ambient conditions.

    Where does Au Club source fly ash?

    Laos, Malaysia, Kazakhstan, and South Africa. Class C and Class F. Up to 1,000,000 MT/year aggregated across origins. FOB/CFR/CIF terms. SGS or Intertek inspection.

    About Au Club

    Au Club supplies bulk fly ash (Class C and Class F) up to 1,000,000 MT/year from Laos, Malaysia, Kazakhstan, and South Africa. FOB, CFR, and CIF terms. SGS or Intertek pre-shipment inspection. We supply ready-mix concrete suppliers, precast producers, and cement plants across the Gulf. Contact our trading desk to discuss your 2026-2030 requirement.
    Sources & further reading

  • Inside the IMO Net-Zero Framework: A $500/MT Carbon Cost Is Coming to Marine Fuel

    Inside the IMO Net-Zero Framework: A $500/MT Carbon Cost Is Coming to Marine Fuel

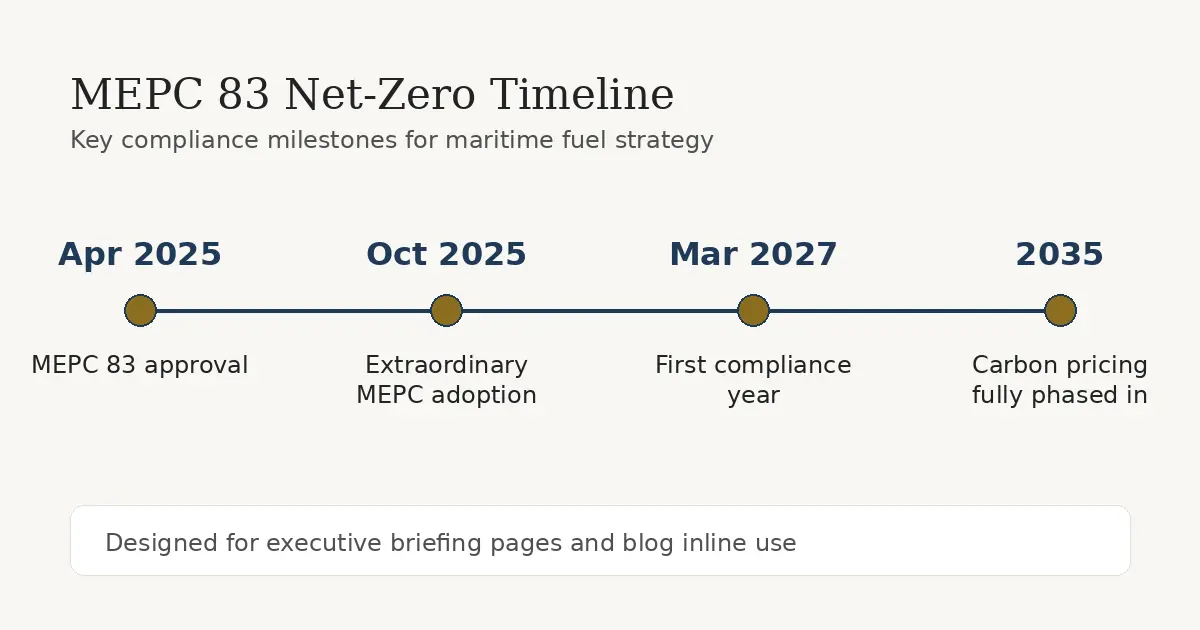
    The IMO’s Marine Environment Protection Committee approved the Net-Zero Framework on 11 April 2025. It introduces a global carbon-pricing mechanism for ocean-going shipping over 5,000 GT, entering force on 1 March 2027. By 2035, vessels exceeding the GHG intensity target will pay up to $380 per ton of CO₂-equivalent for the worst-performing emissions — equivalent to roughly $500 per metric ton of conventional bunker fuel emitted above the base target. For a Suezmax tanker, that translates to several million dollars per year. For a 14,000-TEU container vessel, more. This is the operator’s guide to what was approved, what it means for 2027 bunker contracts, and what to do now.

    MEPC 83 net zero timeline showing Apr 2025 approval, Oct 2025 adoption, Mar 2027 in force, 2035 fully phased in
    Market Snapshot
    $500/MT
    Carbon cost on bunker fuel (2035 worst case)
    1 Mar 2027
    Framework enters force
    5,000 GT
    Vessel size threshold
    $380/tCO₂e
    Top-tier carbon price by 2035

    What MEPC 83 approved

    IMO delegation room with country nameplates conveying regulatory diplomacy

    The 83rd session of the Marine Environment Protection Committee (7-11 April 2025) approved a goal-based fuel standard plus a global pricing mechanism for maritime GHG emissions. The framework applies to all ocean-going vessels over 5,000 GT, covering approximately 85% of global maritime emissions.

    Two components:

    Technical element. A goal-based marine fuel standard that progressively lowers the GHG intensity of marine fuels. Each year sets a target intensity in gCO₂e per MJ of energy delivered. The target tightens over time.

    Economic element. A pricing mechanism for emissions. Vessels measure their actual GHG intensity on a well-to-wake basis (so emissions from fuel production count, not just combustion). Vessels that beat the target earn Surplus Units (SUs). Vessels that exceed the target either retire SUs from a previous compliance year, transfer SUs from other vessels in their fleet, or buy Remedial Units (RUs).

    The RU is the priced unit. The IMO has set RU pricing tiers up to $380 per ton CO₂e for the deepest emission deficits by 2035 — translating to roughly $500 per metric ton of conventional bunker fuel above the base target.

    The framework is due for formal adoption at an extraordinary MEPC session in October 2025. Adoption requires two-thirds of MARPOL Annex VI parties representing at least 50% of world tonnage. Once adopted, it enters force on 1 March 2027 with the first compliance year following.

    The compliance band structure

    MEPC 83 set two compliance tiers. The exact numbers will be confirmed at the October 2025 session, but the working structure is:

    Tier

    Compliance band

    RU price (USD/tCO₂e)

    Direct compliance

    At or below target intensity

    $0

    Base

    Within tolerance band

    $100

    Advanced

    Larger deficit

    $380

    The advanced-tier price is the headline figure. It is high enough to make even moderately above-target operations expensive, and high enough to materially favour LNG, methanol, biofuel, and (eventually) ammonia-fuelled vessels.

    What this costs in practice

    Worked example: 14,000-TEU container vessel, 32,000 MT/year bunker consumption, burning VLSFO at typical well-to-wake intensity of 91 gCO₂e/MJ. Target intensity in 2030 (illustrative): 75 gCO₂e/MJ.

    Emission deficit per MJ delivered: 16 gCO₂e/MJ. At 40,000 MJ/kg energy content for VLSFO and 32,000 MT consumption, that is approximately 51,200 tCO₂e of deficit per year.

    Year

    Tier

    RU price

    Annual carbon cost

    2027 (first year, base tier)

    Base

    $100

    ~$5.1m

    2030 (deeper deficit, base tier)

    Base

    $100

    ~$7m

    2035 (advanced tier)

    Advanced

    $380

    ~$19.5m

    A 14,000-TEU vessel running on VLSFO faces $5m of carbon cost in year one of the framework. By 2035, if the vessel has not moved to lower-intensity fuel, the figure approaches $20m per vessel per year.

    For a Suezmax tanker (14,000 MT bunker/year), scale down proportionally — but the absolute numbers are still meaningful for fleet economics.

    How Surplus Units actually work

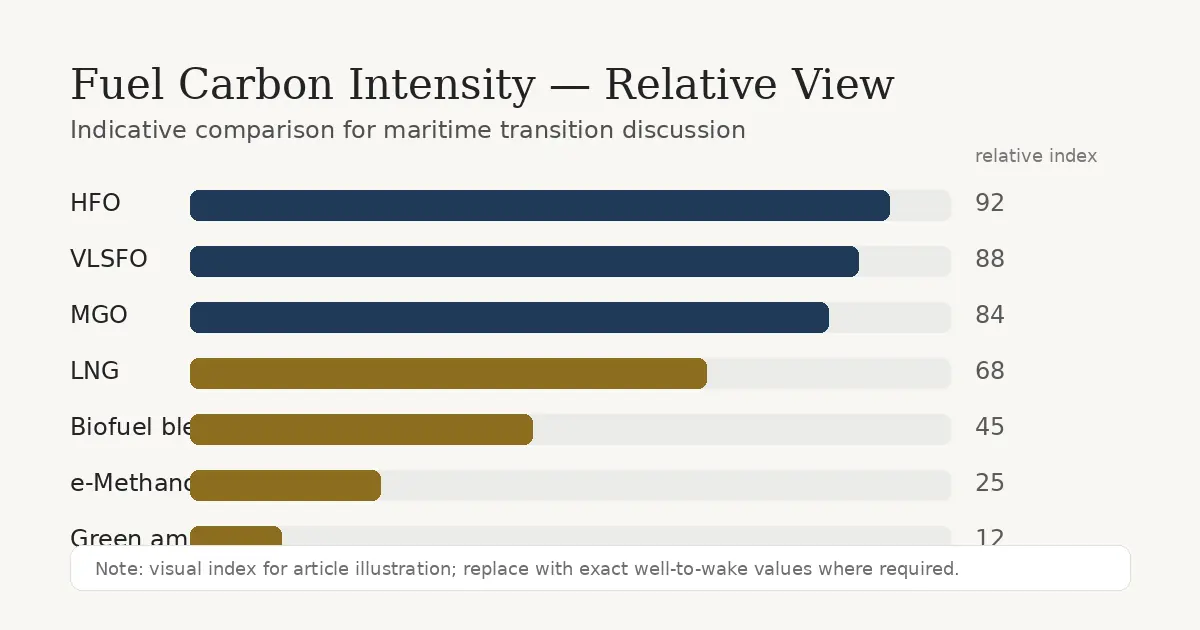
    Bar chart of well-to-wake GHG intensity for HFO, VLSFO, LNG, biofuel, methanol, ammonia

    The Surplus Unit mechanism is the bridge from compliance to commercial reality. A vessel burning LNG might be running at 60 gCO₂e/MJ — well below the 75 target. It earns SUs equal to its annual surplus.

    Three things an owner can do with SUs:

    1. Bank them for use in a future compliance year when their fleet might be above target
    2. Transfer them to another vessel in the same fleet (intra-fleet pooling)
    3. Sell them on the international market (the IMO is establishing the infrastructure)

    The expected price of SUs sits between $0 (cost of compliance for over-performers) and the RU price. Active SU trading should compress prices toward the lower end of the range, but illiquidity in early years will likely keep SUs trading closer to RU prices.

    The result is a real economic incentive for any fleet to have at least some alternative-fuel vessels. A mixed fleet of VLSFO and LNG can use the LNG SUs to offset some of the VLSFO RU obligations — improving overall fleet economics.

    How MEPC 83 sits next to EU ETS and FuelEU Maritime

    Two regional regulations already exist:

    EU ETS for shipping — entered force 1 January 2024. Vessels calling at EU ports pay for 40% of CO₂ emissions in 2024, 70% in 2025, and 100% from 2026. Coverage applies to intra-EU voyages (100%) and extra-EU voyages calling at one EU port (50%).

    FuelEU Maritime — entered force 1 January 2025. Imposes a GHG intensity standard on the energy used by ships calling at EU ports. Tightens 2% in 2025, then progressively to 80% by 2050.

    MEPC 83 Net-Zero Framework — enters force 1 March 2027. Global scope. Covers vessels over 5,000 GT.

    For an Asia-Europe operator, the three regulations stack:

    Voyage

    EU ETS

    FuelEU

    IMO Net-Zero

    Singapore-Rotterdam

    50% of CO₂ priced

    Yes (intensity test)

    Yes (full scope)

    Singapore-Houston

    No

    No

    Yes (full scope)

    Hamburg-Antwerp

    100% of CO₂ priced

    Yes

    Yes

    EU ETS and FuelEU operate independently of the IMO framework, which means an EU-calling vessel pays the regional regimes on top of the global one. There is ongoing negotiation about how to avoid double-counting. The IMO and the European Commission have signalled flexibility but no clean solution has been agreed.

    For now, expect 2027-2030 to involve overlapping compliance obligations and meaningful complexity in voyage planning.

    What to write into 2026 charter parties and bunker contracts

    For charterers — three clauses worth checking in any 2026 fixture:

    1. Carbon cost allocation. Who pays RUs and EU ETS? The CII Operations Clause for Time Charter Parties (BIMCO, 2022) was the first attempt; expect a 2026 update that addresses MEPC 83 specifically.
    2. Surplus Unit ownership. If a chartered LNG vessel generates SUs, do they belong to the owner or the charterer? Time-charter fixtures typically default to the owner unless explicitly assigned. Voyage charters usually keep them with the owner.
    3. Bunker stem flexibility. With MEPC 83 incentivising alternative fuels, charter parties should permit (not just allow) bunker stems of LNG, methanol, biofuel, or biofuel blends where compatible with the vessel’s machinery.

    For bunker contracts, the Au Club desk is moving customers toward: – Fuel intensity certification at point of supply (well-to-tank documentation) – Biofuel blend specification (e.g., B30 means 30% biofuel content) where used – ISO 8217:2024 conformity (the standard now includes alternative fuels)

    Au Club’s read on 2027 readiness

    Three working positions:

    1. The framework will be adopted in October 2025. Indications from the April session were positive. Adoption is procedural rather than uncertain.
    2. VLSFO will remain the dominant fuel through 2027 and likely 2028. Alternative-fuel infrastructure is not at scale outside Singapore and a handful of European ports.
    3. Owners who do nothing in 2025-2026 will pay measurable RU bills from 2027 onward. That cost is going into operating expense, not capex. Even modest action (biofuel blends, route optimisation, hull cleaning, energy efficiency retrofits) reduces the bill.

    For a fleet owner reading this in early 2025: the relevant question is not whether MEPC 83 will happen, but what mix of fuel, vessel efficiency, and SU acquisition makes financial sense for your specific fleet profile. The answer is different for a container owner than for a dry bulk owner; different again for tanker. Build the model now.

    FAQs

    When does the IMO Net-Zero Framework enter force?

    1 March 2027, assuming adoption at the October 2025 extraordinary MEPC session.

    Does MEPC 83 apply to my vessel?

    If your vessel is over 5,000 GT and engaged in international voyages, yes. Domestic voyages within a single country are typically excluded.

    How is GHG intensity measured?

    On a well-to-wake basis — emissions from fuel production plus combustion. Measured in gCO₂e per MJ of energy delivered.

    What is the maximum carbon price?

    Up to $380 per ton CO₂e for the highest tier of non-compliance, equivalent to approximately $500 per ton of conventional bunker fuel above the base target. This is the 2035 figure; earlier years use lower prices.

    Can I use biofuel to comply?

    Yes — sustainable biofuels are recognised. The eligibility criteria for what counts as “sustainable” are still being refined. Biofuel blends like B30 (30% biofuel in HFO or VLSFO) are operational at Singapore and Rotterdam.

    About Au Club

    Au Club supplies VLSFO and HSFO at UAE ports with ISO 8217:2024 documentation. We work with customers on multi-year supply structures that anticipate MEPC 83 compliance obligations. Contact our bunker desk to discuss your 2026-2030 strategy.

    Sources & further reading

  • VLSFO vs HSFO + Scrubber: A 2026 Total-Cost-of-Ownership Decision

    VLSFO vs HSFO + Scrubber: A 2026 Total-Cost-of-Ownership Decision

    Five years after IMO 2020, the scrubber decision is no longer about whether the technology works. It is about whether the HSFO-to-VLSFO price spread is wide enough to amortise the capital cost before the next regulatory step changes the maths again. With MEPC 83 approving a carbon-pricing framework that takes effect on 1 March 2027, the answer for a vessel built around 2020-2021 has shifted from “obvious yes” to “depends on age, trade lane, and how aggressively you discount future carbon costs.” Here is the framework Au Club’s customers are using to make the 2026 decision.

    Market Snapshot
    0.50%
    IMO global sulphur cap
    1 Mar 2027
    Net-Zero Framework effective
    5 yrs
    Since IMO 2020 came into force
    $2–4M
    Scrubber retrofit capex range

    What changed since IMO 2020 took effect

    On 1 January 2020 the IMO’s 0.50% global sulphur cap entered force. Operators had three compliance options:

    1. Burn VLSFO (very low sulphur fuel oil) at 0.50% sulphur, or MGO/MDO
    2. Install a scrubber (Exhaust Gas Cleaning System, EGCS) and continue burning HSFO at 3.5% sulphur
    3. Switch to LNG, methanol, or another alternative fuel

    Roughly 25% of the world fleet by tonnage installed scrubbers — disproportionately concentrated in container, tanker, and bulker segments where bunker is a high share of operating cost. Most of the remainder run on VLSFO.

    The scrubber spread (the HSFO-to-VLSFO price differential) drove the economics. In early 2020 the spread averaged $250-300 per MT. With a typical scrubber capital cost of $4-8 million depending on vessel size, payback periods were one-to-three years for a modern Suezmax or VLCC.

    Then the spread compressed.

    The scrubber spread in 2020-2025

    HSFO–VLSFO spread at Fujairah and Singapore, monthly averages

    Period

    Fujairah (/MT)

    Q1 2020

    $290

    $310

    Q1 2021

    $90

    $105

    Q1 2022

    $145

    $160

    Q1 2023

    $130

    $145

    Q1 2024

    $110

    $125

    Q1 2025

    $95

    $115

    The compression was driven by two structural forces. Refineries adjusted their crude slate and product mix to produce more VLSFO. HSFO demand fell as part of the fleet converted permanently to VLSFO. The spread settled into a $80-130/MT range that has held for about three years.

    At a $100/MT spread, a 200,000-MT-per-year bunker consumer saves $20 million per year by running HSFO + scrubber. That is still a meaningful number for a fleet operator. But at a $250/MT spread, the same operator was saving $50 million. The economics moved from “compelling” to “good.”

    What the TCO model actually compares

    A five-year total-cost-of-ownership comparison for a Suezmax tanker (modeled here as an illustrative working example, not specific operator economics):

    Assumptions: – Vessel: Suezmax, 158,000 DWT – Annual bunker consumption: 14,000 MT – VLSFO price assumption: $580/MT – HSFO price assumption: $480/MT (spread $100/MT) – Scrubber capex (open-loop): $4 million, fully amortised over 5 years – Scrubber sludge disposal, NaOH (closed-loop only), and maintenance: $80,000/year per scrubber – MEPC 83 carbon-pricing impact phased in from March 2027 (so 2 years out of 5)

    Five-year cumulative cost (USD millions)

    Component

    VLSFO

    HSFO + open-loop scrubber

    HSFO + closed-loop scrubber

    Bunker

    $40.6

    $33.6

    $33.6

    Scrubber capex

    $0

    $4.0

    $5.5

    Scrubber opex

    $0

    $0.4

    $1.2

    MEPC 83 carbon (2027-2029, estimated)

    $1.8

    $2.6

    $2.6

    Sludge + waste handling

    $0

    $0.2

    $0.6

    Total

    $42.4

    $40.8

    $43.5

    At a $100/MT spread, an open-loop scrubber breaks even or modestly outperforms VLSFO over five years on this profile. A closed-loop scrubber does not — the additional opex (sodium hydroxide for neutralisation, sludge disposal) offsets the bunker saving.

    The number that matters is the spread. At $130/MT, open-loop wins comfortably. At $80/MT, it loses. Lock yourself into a regulatory environment that further raises HSFO’s emission cost (the MEPC 83 carbon factor) and the model tightens against scrubbers.

    Operational realities the TCO model doesn’t capture

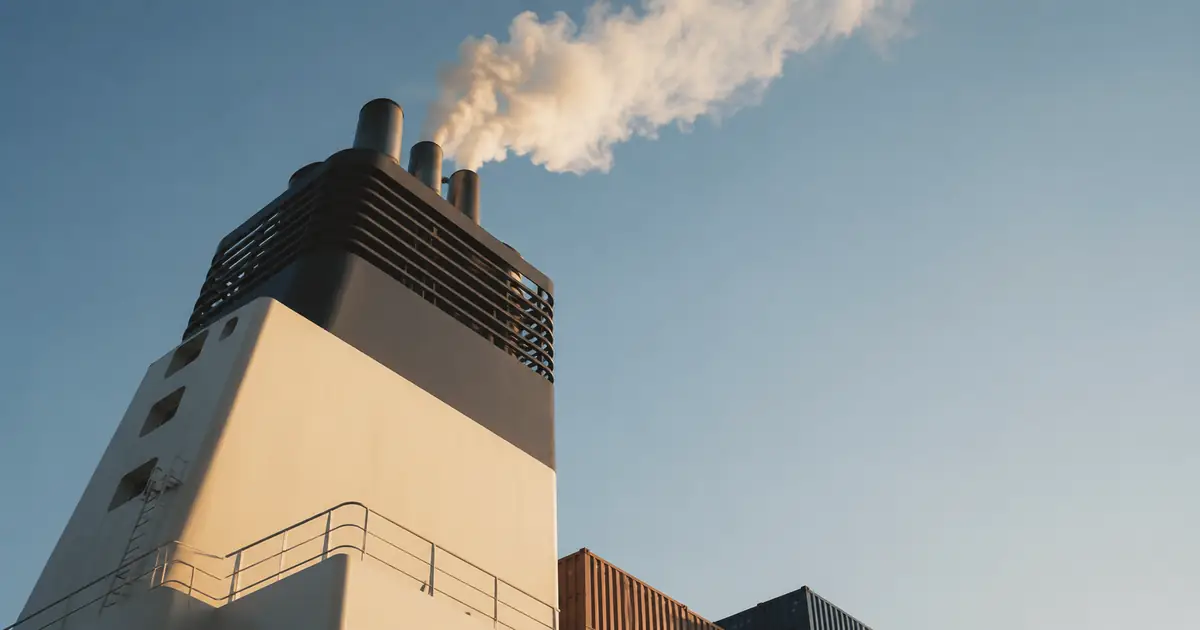
    Close-up of scrubber funnel installation on vessel stack

    Three considerations that matter and are hard to quantify:

    Open-loop discharge restrictions. Singapore prohibits open-loop scrubber discharge inside port limits. China’s coastal Emission Control Areas (Bohai, Yangtze River Delta, Pearl River Delta) restrict open-loop operation. The EU is debating tighter rules under FuelEU Maritime and revised port-state controls. Open-loop scrubbers are progressively losing operational windows. A vessel that spends 30% of its time in restricted waters loses 30% of the scrubber benefit on those legs.

    Closed-loop opex. Closed-loop scrubbers do not discharge to sea, but they consume sodium hydroxide (caustic soda) and generate sludge that must be disposed of. NaOH consumption runs $50-150,000/year per vessel depending on operating profile. Sludge disposal at major ports varies; some ports charge $200-500/m³.

    Resale value. A scrubber-fitted vessel commands a premium in the second-hand market when the spread is wide and a penalty when the spread is narrow. Predicting this five years out is genuinely difficult.

    Carbon-pricing exposure. MEPC 83 prices Remedial Units at up to $380 per ton CO₂e above the base target by 2035. HSFO has a higher carbon factor than VLSFO (3.114 vs 3.151 — actually marginally lower per MT of fuel, because VLSFO has more carbon per MT). The well-to-wake intensity matters more than tank-to-wake under the IMO framework. Run the calculations with your bunker consumption and the framework’s intensity tables.

    Decision tree for an owner or operator

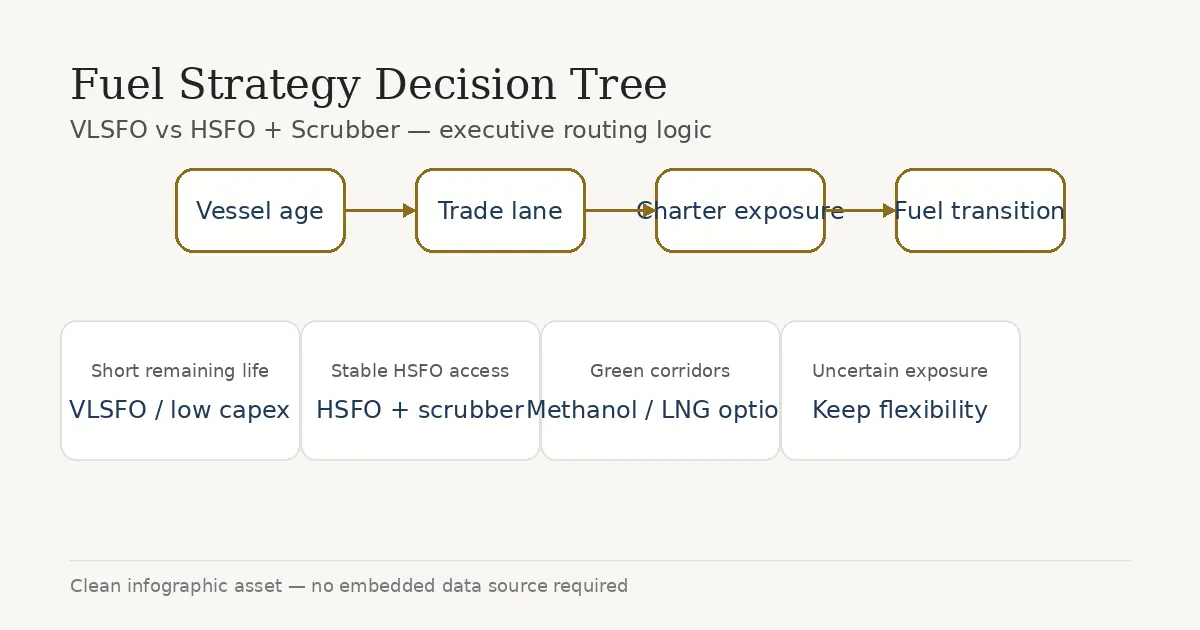
    Decision tree for fuel strategy by vessel age, trade lane, charter exposure

    Practical questions Au Club’s customers run through:

    1. Vessel age. If your vessel is under five years old and has fifteen years of trading life ahead, the capex amortisation works. If she has ten or fewer years left, payback windows are tight.
    2. Trade lane scrubber-friendliness. What share of your trading time is in open ocean vs in scrubber-restricted ports / ECAs? Open ocean tramping favours scrubbers. Asian intra-region container service does not.
    3. Charter market exposure. Are you trading on time charter (where the charterer pays bunkers) or on the spot market (where bunker cost is yours)? Spot market exposure makes the scrubber argument harder because spreads are unpredictable.
    4. Capital cost of capital. A high WACC penalises capex-heavy options. An owner with cheap debt sees scrubbers more favorably than one without.
    5. Future regulatory exposure. Lower-carbon fuels (LNG, methanol, biofuel) will further compress the scrubber economics over time. If you expect to convert to LNG within 7-10 years, do not install a scrubber now.

    What we are telling fleet owners

    Three working assumptions Au Club uses with customers in early 2025:

    1. Do not retrofit a scrubber to an existing VLSFO-burning vessel under 15 years old unless you have very specific circumstances. The capex payback period at current spreads is tight against further regulatory cost on HSFO.
    2. If you already have a scrubber, keep running it. Operating cost is meaningful but the capex is sunk. The five-year economics still work at $100/MT spread for most asset classes.
    3. For new-builds, evaluate LNG, methanol, and dual-fuel capability seriously. The 2027-2030 regulatory environment favours alternative fuels.

    For mid-sized operators without inside views on refinery margins, the simplest rule is: lock VLSFO supply with a multi-year contract, monitor the scrubber spread monthly, and re-run the TCO model annually.

    FAQs

    What is the current HSFO-VLSFO spread at Fujairah?

    As of Q1 2025, the spread is averaging around $95/MT. Contact our bunker desk for spot quotes.

    Should I install a scrubber on a new-build vessel?

    For most asset classes in 2025, no — the economics no longer support a 3-5 year payback at current spreads, and forward-looking carbon pricing further compresses the case. Evaluate LNG or methanol dual-fuel instead.

    Are open-loop scrubbers banned?

    Not globally. Singapore prohibits open-loop discharge inside port limits. China’s coastal ECAs restrict open-loop operation. The EU is reviewing rules. UAE waters currently allow open-loop discharge.

    What does MEPC 83 do to my fuel cost?

    The carbon-pricing framework enters force on 1 March 2027 and can add up to $380 per ton CO₂e by 2035 for fuel emissions above the base target. For a Suezmax burning VLSFO, that translates to a meaningful per-voyage cost. Au Club’s MEPC 83 article walks through worked examples.

    About Au Club

    Au Club supplies VLSFO (0.5% S) and HSFO (3.5% S) marine fuels at Jebel Ali, Port Khalifa, Fujairah, and Khor Fakkan. Multi-year supply contracts available. ISO 8217:2024 compliant. Contact our bunker desk to discuss your 2025-2026 bunker strategy.

    Sources & further reading

  • China Just Added Tungsten and Molybdenum to Its Export Control List. What Happens Next.

    China Just Added Tungsten and Molybdenum to Its Export Control List. What Happens Next.

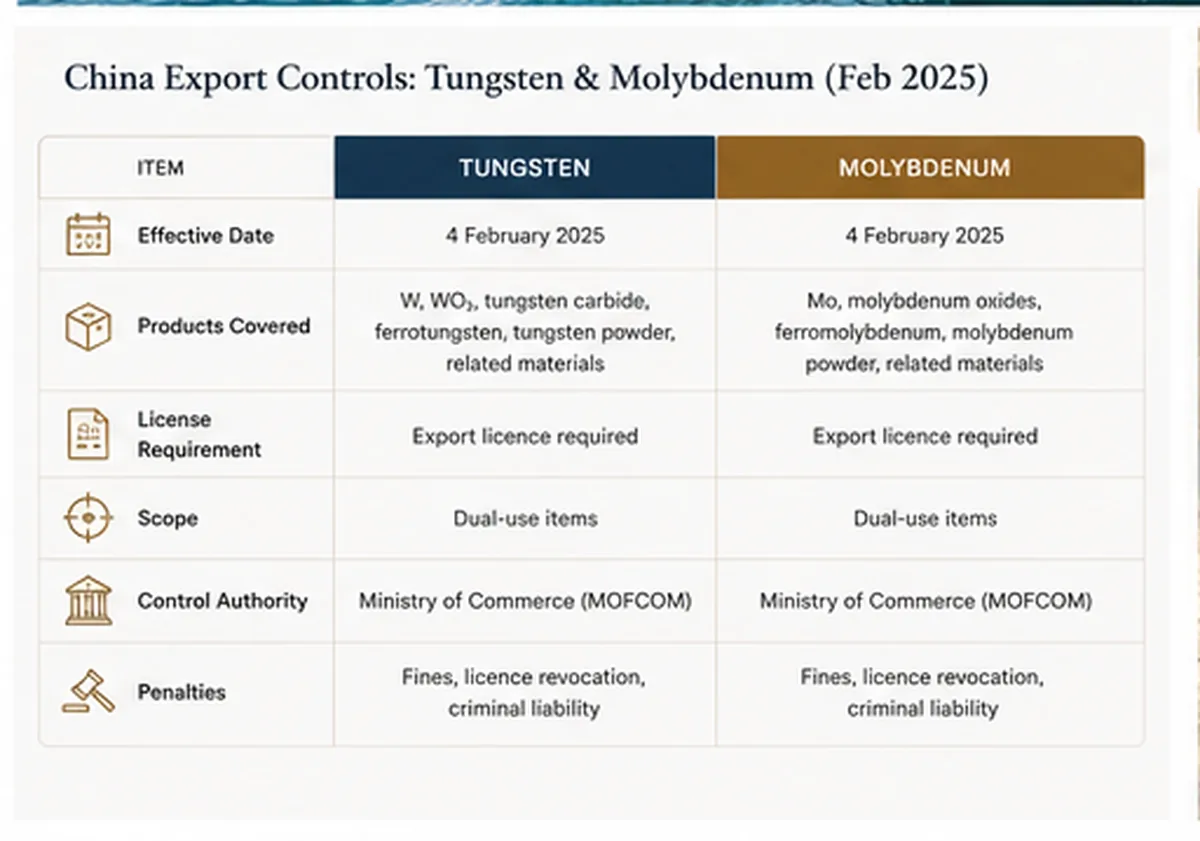
    On 4 February 2025 MOFCOM placed tungsten, tellurium, bismuth, indium and molybdenum on China’s dual-use items export control list. This is the same mechanism that took antimony from $1,400 to $51,000 per metric ton in six months. China supplies roughly 80% of world tungsten and is a dominant molybdenum producer. The price reaction has not yet matched antimony’s, but the mechanism is identical, the precedent is fresh, and the structural picture for Western buyers of APT, ferro-tungsten, and molybdenum oxide is now materially different from what it was a week ago.

    Market Snapshot
    80%
    China share of world tungsten
    5
    Minerals added to control list
    4 Feb 2025
    MOFCOM announcement
    27×
    Antimony precedent (price multiplier)

    What the 4 February notice actually says

    The MOFCOM announcement adds export licensing requirements for tungsten, tellurium, bismuth, molybdenum, and indium and their related items. As with the September 2024 antimony notice:

    • Exporters must apply for individual licences for each shipment
    • End-user and end-use disclosure is required
    • Supporting documentation must accompany each application
    • MOFCOM retains discretion over which licences are approved
    • No country is named in the restriction, but the timing — five days after the US announced 10% tariffs on Chinese imports — is unambiguous

    What the notice does not say is when licences will be approved, what criteria will apply, or whether dual-use civilian applications (cutting tools, stainless steel, lubricants) will be treated differently from defence-adjacent applications (armour-piercing rounds, missile guidance, superalloys).

    The antimony precedent is informative. In the months after the September 2024 antimony licence regime took effect, Chinese exports collapsed by approximately 97%. Few licences have been granted publicly. Sources close to MOFCOM have described the approval rate as deliberate and quiet.

    Why tungsten is the more strategic of the two

    China accounts for approximately 80% of world tungsten mine production. The next largest producers are Vietnam (~5%), Russia (~3%), and a handful of smaller producers in Bolivia, Portugal, Spain, Rwanda, and Austria. The world’s commercially significant tungsten flow has gone through Chinese smelters for thirty years.

    Tungsten is irreplaceable in specific applications. Its melting point (3,422°C) and density (19.3 g/cm³) make it the dominant material for:

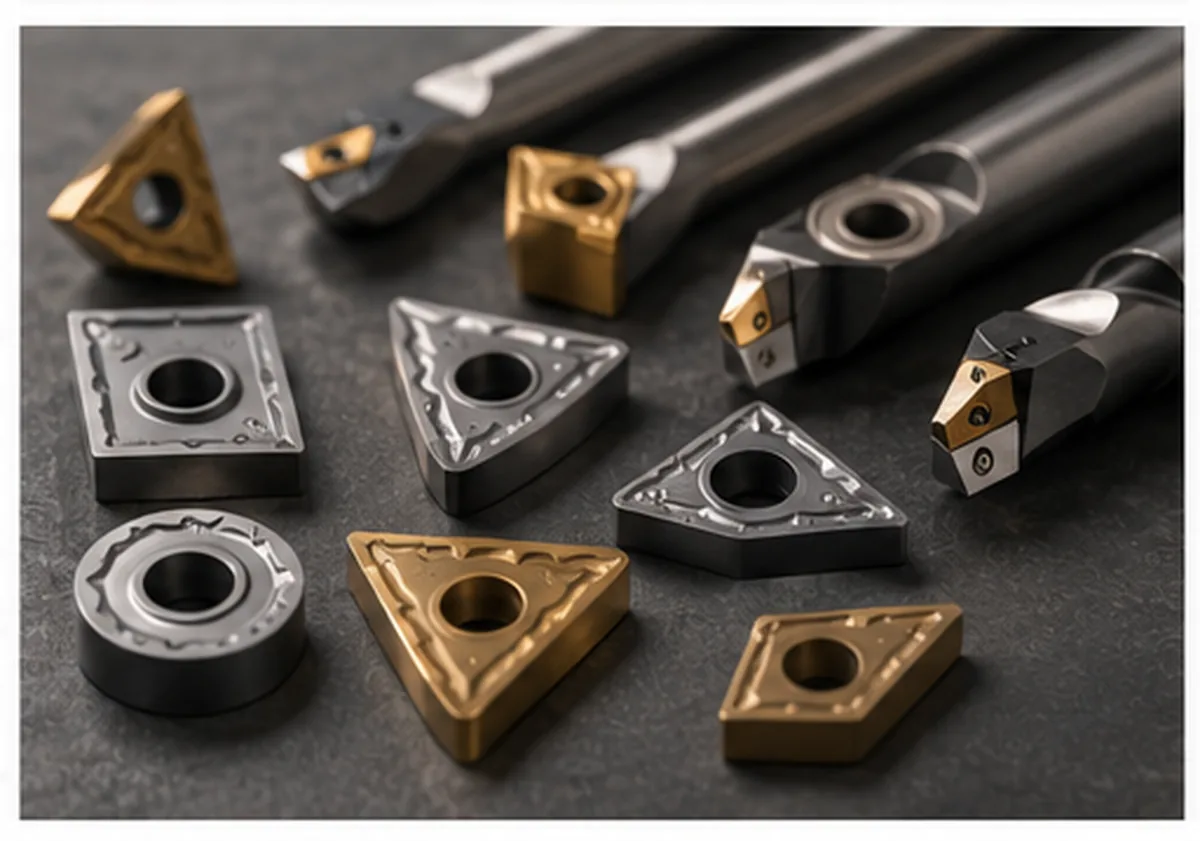
    • Cutting tools — tungsten carbide inserts for machining steel, aluminium, and composites
    • Armour-piercing ammunition — kinetic energy penetrators (replacing depleted uranium in some military applications)
    • Filaments and electrodes — though incandescent applications have declined, TIG welding electrodes and X-ray tube anodes still rely on tungsten
    • Heavy alloys — radiation shielding, gyroscope rotors, counterweights
    • Superalloys — turbine blades, where tungsten is alloyed with nickel and other refractory metals

    The substitution path is poor. Cubic boron nitride substitutes for some cutting-tool applications but at higher cost. Synthetic diamond cuts certain materials better but cannot replace tungsten carbide across the board. There is no substitute at all for tungsten in heavy alloy and ammunition applications.

    The price reaction so far

    Table of China export control timeline and benchmark price moves

    By early June 2025, European ammonium paratungstate (APT) prices were up over 40% from the start of the year. European ferro-tungsten rose 17.6%. The 4 February announcement was the catalyst; the actual licence approvals (or non-approvals) have driven the rolling repricing through Q1 and Q2.

    Tungsten benchmark price moves, Jan–June 2025

    Benchmark

    Jan 2025

    June 2025

    Change

    European APT (USD/MTU WO₃)

    $300

    $425+

    +40%+

    European ferro-tungsten (USD/kg W)

    $34

    $40

    +17.6%

    Chinese 65% concentrate (CNY/MTU)

    110,000

    138,000

    +25%

    A material number of tungsten APT consumers — particularly mid-sized cutting tool manufacturers in Germany, Italy, the US, and Japan — have reported difficulty securing 2026 supply at any forward-priced contract.

    Molybdenum: less concentrated than tungsten, but exposed to the same mechanism

    Molybdenum is structurally different. Roughly half the world’s moly is mined as a primary product (in places like New Mexico, Chile, China). The other half is a by-product of copper porphyry mining at Codelco, Freeport, Antofagasta, and several other large copper producers. That diversification provides some structural cushion against any single producer.

    But China is still the largest moly producer at approximately 40% of global supply. And Chinese moly oxide refining serves global steel mill markets. The MOFCOM licence regime applies to molybdenum and related items — including ferromolybdenum and moly oxide. If approvals slow, the impact lands on Western stainless steel mills, aerospace alloy producers, and lubricant additive manufacturers.

    Through Q2 2025, US moly prices reached $50,265 per MT and Chinese 45% concentrate hit a record 4,600 CNY/ton-unit. The licence regime is one of several drivers (stainless steel demand from grid-scale infrastructure has been strong), but it is a meaningful share of the move.

    Where non-Chinese tungsten and molybdenum lives

    Au Club’s working view of non-Chinese supply for both metals:

    Non-Chinese tungsten

    Country

    Producer / mine

    Indicative output

    Notes

    Vietnam

    Masan High-Tech Materials (Nui Phao)

    ~5,000 t WO₃

    Largest non-China primary tungsten mine

    Thailand

    Multiple small producers

    Variable

    Au Club origin; FOB Laem Chabang

    Malaysia

    Small mines

    Modest

    Au Club origin

    Bolivia

    Several mines

    Modest

    Through Pacific ports

    Portugal

    Beralt Tin and Wolfram

    Modest

    EU buyers

    Spain

    Barruecopardo

    Modest

    EU buyers

    Russia

    OMG, Tyrnyauz

    Significant

    Sanctioned for US/UK direct sale

    Australia

    EQ Resources (Mt Carbine)

    Growing

    Restart phase

    Non-Chinese molybdenum

    Country

    Producer

    Approx share

    Notes

    Chile

    Codelco, Antofagasta

    ~20%

    By-product, scale, captive

    US

    Freeport (Henderson, Climax)

    ~15%

    Primary mines + Cu by-product

    Peru

    Southern Copper, others

    ~10%

    Cu by-product

    Mexico

    Mexicana Cananea

    ~5%

    Cu by-product

    Iran

    NICICO

    ~3%

    Sanctions complications

    Mongolia

    Erdenet

    ~3%

    Cu by-product

    Armenia

    Zangezur

    ~2%

    Cu by-product

    Au Club supplies molybdenum oxide (MoO₃, 63% Mo minimum) with 300 MT/month availability and tungsten concentrate (55–65% WO₃) from Thailand and Malaysia. Tungsten scrap — both carbide and soft scrap — is sourced regionally and is a meaningful partial hedge for cutting-tool buyers facing APT shortages.

    How to position your supply book

    Three actions worth taking now:

    1. Audit your 2025-2026 forward contracts. If your existing supplier is Chinese — directly or via a smelter that aggregates Chinese ore — your contract is exposed to licence non-approval.
    2. Open a relationship with at least one non-Chinese supplier. Even at higher unit cost. The option value of having a working non-China channel exceeds the price premium.
    3. For tungsten carbide buyers, evaluate scrap. Tungsten carbide scrap can be re-processed into APT or used directly in some applications. Scrap pricing has tracked APT closely but with more available volume.

    For very large buyers, multi-year offtake agreements with non-Chinese producers (Masan, Codelco, Freeport, EQ Resources) are now more accessible than they were in 2023 because Western producers are looking for non-China end-market commitments.

    Au Club’s read

    Tungsten and molybdenum are not going to retrace to pre-February 2025 levels in any realistic 2025 scenario. Our working range for European APT through 2025 is $420-520 per MTU WO₃. For US moly, $50,000-$60,000 per MT. The downside scenario — large MOFCOM approval wave — requires a US-China trade agreement that has not been signalled at any working level.

    What we are telling buyers: do not wait for clarity. The clarity, when it comes, will come in the form of further escalation or a long, quiet plateau at higher prices. Build your non-China book now.

    FAQs

    Are tungsten exports from China actually banned?

    No. They are under a licensing regime. The practical effect — based on the antimony precedent and limited approved licences since 4 February 2025 — has been a sharp reduction in Chinese tungsten export flow. Whether this constitutes a de facto embargo depends on MOFCOM’s approval rate over time.

    Where can I source non-Chinese tungsten?

    Vietnam (Masan Nui Phao), Thailand, Malaysia, Bolivia, Portugal, Spain, and (when sanctioned imports clear) Russia. Australia (Mt Carbine) is restarting commercial production. Au Club supplies concentrate from Thailand and Malaysia, plus tungsten scrap.

    Is tungsten carbide scrap a viable substitute for APT?

    For many cutting-tool re-manufacturing applications, yes. Scrap re-processing into APT is established technology. The economics work when APT prices are this elevated. Au Club buys and sells both carbide and soft tungsten scrap.

    Will the price come back down?

    Au Club’s working view is no, not in 2025. A return to early-2024 prices requires a meaningful US-China trade agreement and a clear MOFCOM approval pattern, neither of which has been signalled.

    About Au Club

    Au Club is a Dubai-based commodity trading company specialising in metals, minerals, and marine fuels. We supply tungsten concentrate (55-65% WO₃) from Thailand and Malaysia, tungsten scrap (carbide and soft), and molybdenum oxide (MoO₃ 63% Mo minimum). SGS or Alex Stewart pre-shipment inspection. LC and TT accepted. Contact our trading desk.

    Tungsten oxide stored in warehouse with quality control inspector

    Sources & further reading

  • Red Sea Rerouting: How the Cape of Good Hope Is Redrawing Bunker Demand

    Red Sea Rerouting: How the Cape of Good Hope Is Redrawing Bunker Demand

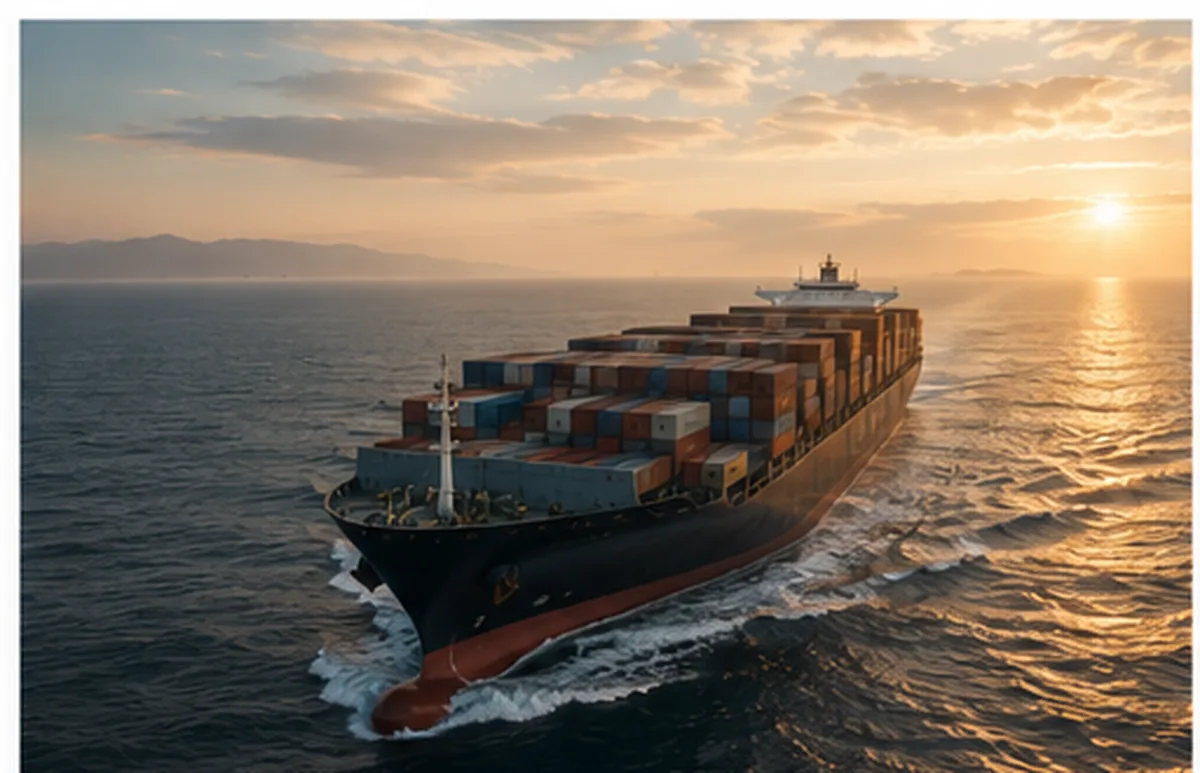
    The Cape of Good Hope diversion costs roughly $1 million in extra bunker per Asia-Europe round-trip and adds about ten days at sea. If your fleet was built around a Suez-Bab-el-Mandeb routing — and most container, tanker, and Capesize operators planned that way for thirty years — your 2025 fuel budget is structurally different from your 2022 budget. This article walks through the cost, the new map of bunker demand, and what we are telling charterers about where the demand picture goes from here.

    Market Snapshot
    $1M+
    Extra bunker per Asia-EU round trip
    +10 days
    Added voyage time via Cape
    Nov 2023
    Houthi attacks began
    ~30%
    Suez container traffic drop (2024)

    The disruption in numbers

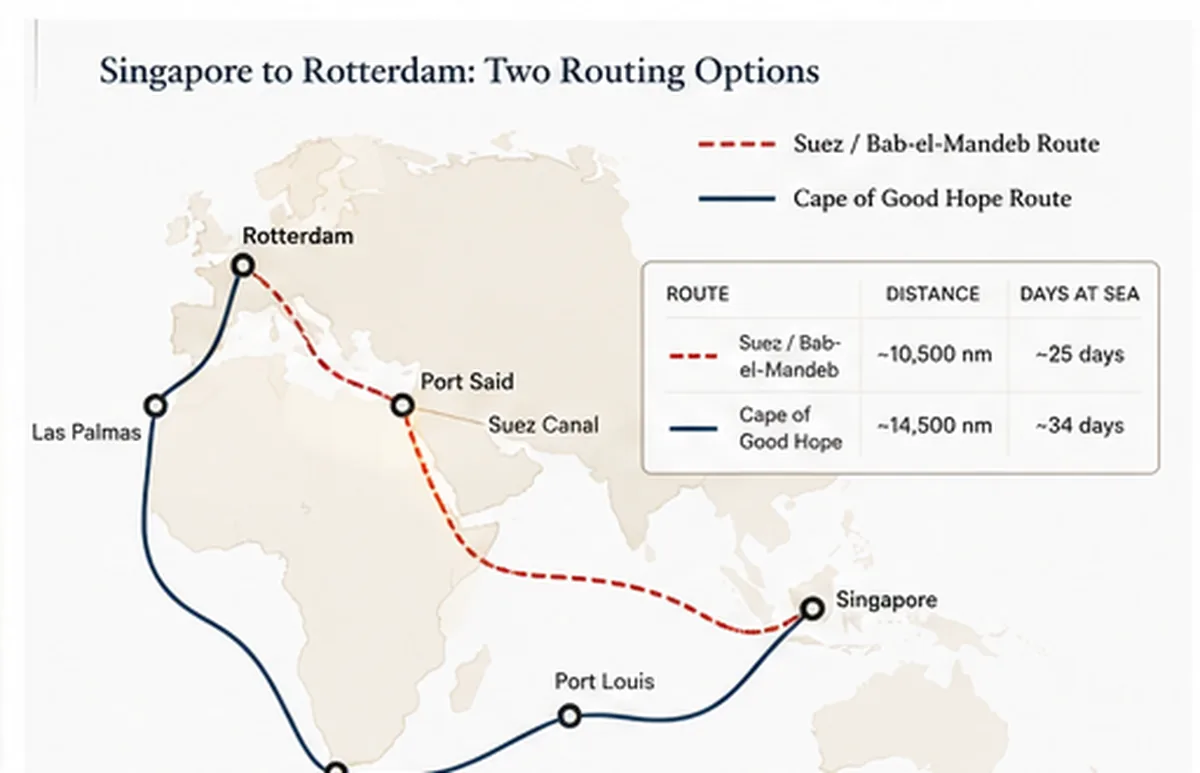
    Map comparing Suez/Bab-el-Mandeb route and Cape of Good Hope route from Singapore to Rotterdam

    Houthi attacks on commercial shipping in and around Bab-el-Mandeb began in November 2023. By October 2024 the US Defense Intelligence Agency had counted over 190 attacks. Container shipping through the Red Sea dropped by approximately 90% between December 2023 and February 2024.

    The major carriers responded by rerouting. Maersk, MSC, CMA CGM, Hapag-Lloyd, Evergreen and ONE moved the bulk of their Asia-Europe and Asia-US East Coast services around the Cape of Good Hope. Tanker operators and dry bulk owners followed for vessel classes where the war-risk premium outweighed the routing cost.

    By late 2024 the Houthis signalled willingness to halt attacks. Marine underwriters did not return to pre-2023 risk pricing. Most major operators kept the Cape routing through January 2025.

    What the diversion costs per voyage

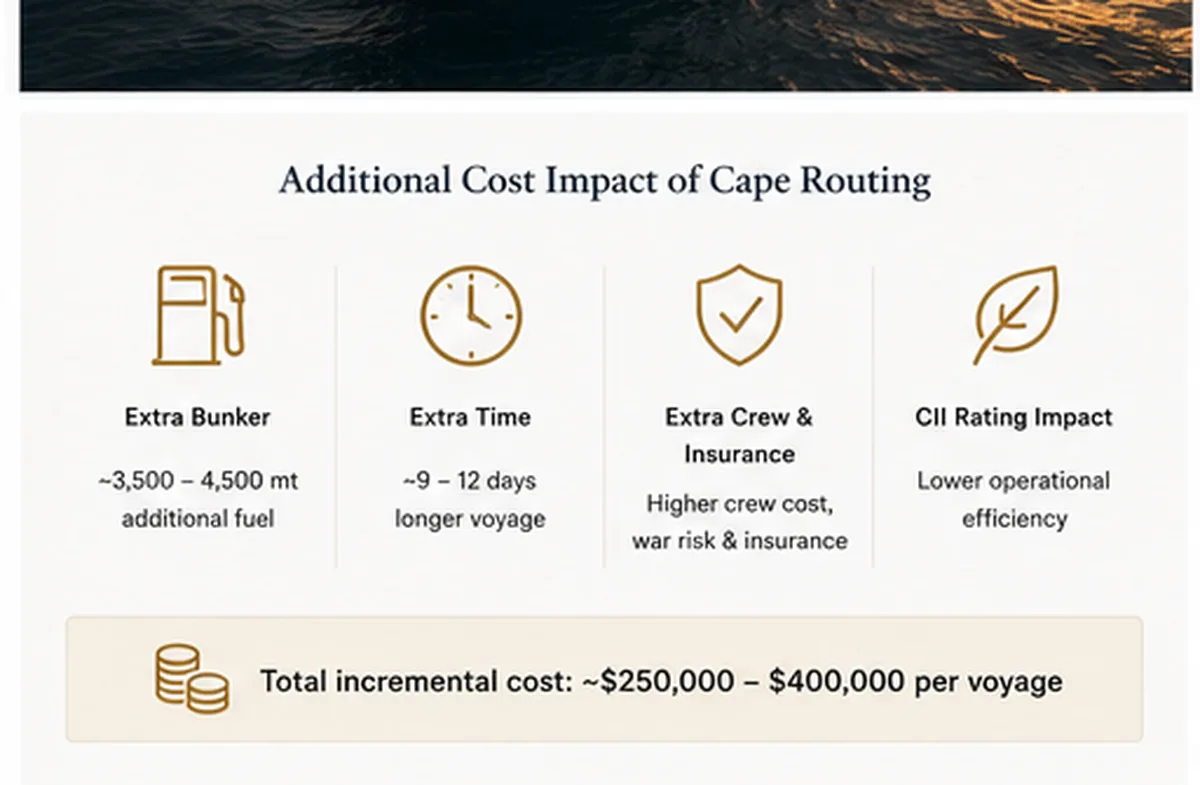
    Infographic of four cost components added by Cape routing: bunker, time, insurance, CII

    The Cape of Good Hope routing adds roughly 3,500 nautical miles each way on a Singapore–Rotterdam round-trip. At commercial steaming speeds, that is about ten extra days. The bunker cost depends on vessel class and consumption.

    Worked example: 14,000-TEU container vessel, 220 MT/day VLSFO consumption at sea speed, $580/MT average bunker price.

    Item

    Suez routing

    Cape routing

    Delta

    One-way distance (nm)

    8,300

    11,800

    +3,500

    Sea days at 18 kts

    19

    27

    +8

    Round-trip bunker (MT)

    8,360

    11,880

    +3,520

    Round-trip bunker cost

    $4.85m

    $6.89m

    +$2.04m

    Plus war-risk premium for Suez route (if used)

    $300-700k

    n/a

    included

    A Suezmax tanker on the same Asia-Europe lane sees a similar order-of-magnitude increase in absolute terms, less in percentage terms. A Capesize bulk carrier on Iron Ore Australia–Europe routes via Cape was already the standard, so for that vessel class the change is smaller.

    For a container line running fifteen weekly strings on Asia-Europe, the cumulative bunker shift is significant — multiple billions of dollars per year of incremental fuel demand globally.

    How global bunker demand has redistributed

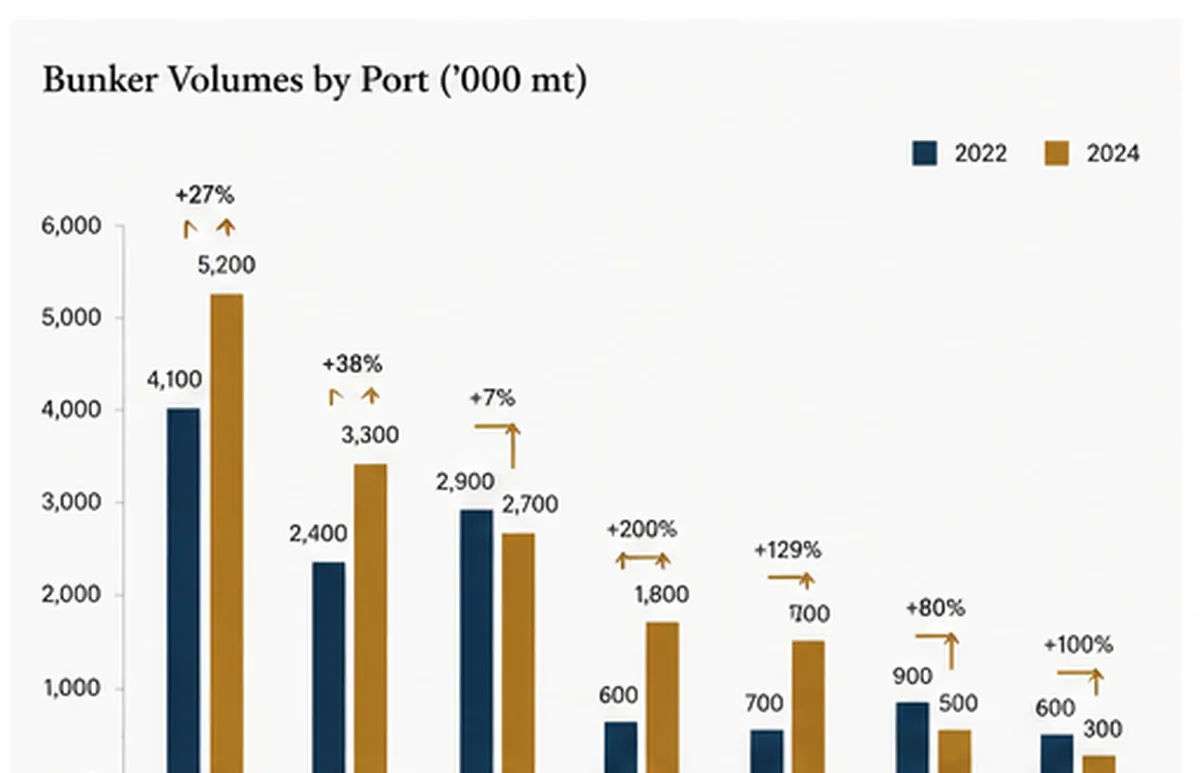
    Bar chart of bunker volumes by port 2022 vs 2024 showing Port Louis and South African ports rising

    The geographic redistribution is what matters for trading desks. The traditional bunker hubs — Singapore, Fujairah, Rotterdam, Algeciras, Las Palmas — have all moved, but in different directions.

    Port

    2022 volume (MT)

    2024 volume (MT)

    Change

    Singapore

    ~50m

    ~54.9m

    Modest rise

    Fujairah

    ~30m

    ~33m

    Steady rise

    Rotterdam

    ~9.5m

    ~10.2m

    Slight rise

    Port Louis (Mauritius)

    ~0.5m

    ~1.0m

    Doubled

    Cape Town

    ~0.6m

    ~0.9m

    +50%

    Durban

    ~0.5m

    ~0.8m

    +60%

    Algoa Bay (anchorage)

    ~0.1m

    ~0.3m

    Tripled

    The South African and Indian Ocean island ports are the standout movers. Vessels rerouting around the Cape need to refuel somewhere on the southern leg. Port Louis in Mauritius has become a meaningful staging port; Algoa Bay anchorage off Port Elizabeth has tripled from a small base.

    For Fujairah, the impact is more subtle. The port did not lose Asia-Europe transit volume — that traffic was always east of the Strait of Hormuz. What it gained was firmer demand from Indian Ocean voyages that previously chose to bunker at Salalah (Oman) or at Aden (no longer viable). Fujairah’s anchorage congestion has increased; barge waits have lengthened in peak weeks.

    What changed between the late 2024 Houthi ceasefire and early 2025

    The Houthi political wing made statements in late 2024 indicating willingness to halt attacks on commercial shipping. The maritime market did not snap back. Three reasons:

    Insurance. War-risk premiums for Bab-el-Mandeb transit climbed through 2024 to multiple percent of hull value for some vessel classes. Underwriters require sustained risk-free passage before re-pricing.

    Schedule reliability. Carriers built their 2025 sailing schedules around Cape routing in mid-2024. Re-routing back to Suez mid-schedule introduces port-omission risk, charter-party conflicts, and customer-service problems. Most carriers committed to the Cape route at least through Q2 2025.

    Underwriter caution. Even if the route reopens, a single attack will close it again. Several major underwriters indicated they wanted six months of unbroken safe passage before reducing war-risk premiums to pre-2023 levels.

    The result is a slow, conditional return — not a switch back.

    How charter parties are repricing risk

    In 2024 charter party clauses had to be rewritten to accommodate the new routing. The most-used updates:

    • BIMCO War Risks Clause for Time Chartering 2013 activated to allow re-routing without breaching the charter
    • Conwartime 2013 for voyage charters, with the Cape route as an explicit alternative
    • Bunker Adjustment Factor (BAF) for liner shipping, repriced to reflect actual Cape-route consumption
    • CII assistance clauses to accept that the longer route worsens the vessel’s Carbon Intensity Indicator rating — and to allocate the cost between owner and charterer

    The CII issue is awkward. The IMO’s Carbon Intensity Indicator measures grams of CO₂ per deadweight-ton-mile. A longer routing means more emissions, but also more distance, so the per-distance metric does not necessarily worsen as much as raw fuel consumption suggests. Different charter forms allocate the rating penalty differently. Pre-2024 CP language does not handle this cleanly; expect to see CII-specific addenda in 2025 fixtures.

    What we are telling charterers

    Three working assumptions Au Club’s desk uses with charterer customers through 2025:

    1. The Cape routing continues for most carriers through Q2 2025 at minimum. Insurance and schedule inertia will outlast the operational risk reduction.
    2. Fujairah bunker premia to Singapore will hold or widen modestly. Indian Ocean rerouting and the Gulf’s stable supply give Fujairah a strategic role in 2025 that 2022 routing planning did not anticipate.
    3. Plan bunker stems with longer lay-cans. Anchorage congestion at Cape Town and Fujairah peaks unpredictably. Build flexibility into the charter party.

    For voyage owners contracted on liner-fed routes, the bunker arithmetic has changed enough that 2022’s optimised stemming plans no longer apply. Re-modelling annual bunker cost with Cape-route assumptions is now a quarterly exercise, not an annual one.

    FAQs

    Are ships still avoiding the Red Sea in January 2025?

    The majority of container shipping on Asia-Europe lanes continues to use the Cape of Good Hope route. Tanker traffic is mixed. Some bulk carriers have returned to the Suez route. Underwriter caution and schedule commitments make a full return unlikely before Q2 2025.

    How much extra fuel does the Cape route use?

    For a 14,000-TEU container vessel on Singapore-Rotterdam round-trip, approximately 3,500 MT extra VLSFO per round-trip, or about $2 million at $580/MT. Suezmax and Capesize equivalents differ.

    Where are ships bunkering on the Cape route?

    The growth ports are Port Louis (Mauritius), Cape Town, Algoa Bay anchorage, and Durban. Singapore, Fujairah, and Rotterdam remain dominant but for different reasons (Singapore Asia-end staging, Fujairah Indian Ocean staging, Rotterdam Europe-end).

    Has Fujairah benefited from the Red Sea crisis?

    Yes, modestly. Indian Ocean routing benefits Fujairah’s strategic position east of Hormuz. Bunker volume rose to approximately 33 million MT in 2024.

    About Au Club

    Au Club supplies VLSFO and HSFO marine fuels at Fujairah, Jebel Ali, Port Khalifa, and Khor Fakkan. ISO 8217:2024 compliant. Multiple physical suppliers per port for competitive price discovery. ISO 14001-aligned procedures. Contact our bunker desk for stem enquiries.

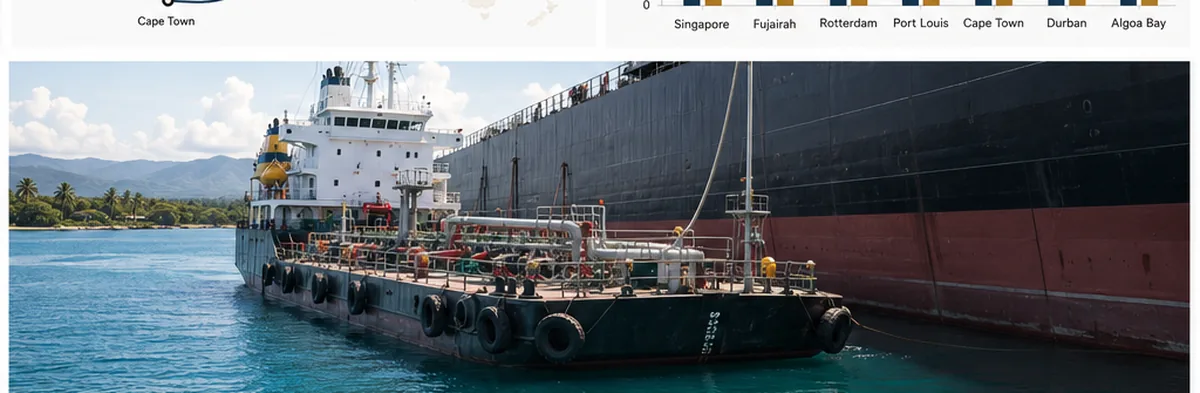
    Bunker barge alongside large vessel at Port Louis anchorage

    Sources & further reading

  • Tin Market Outlook 2024: Supply Tightness, Demand Resilience, Price Support

    Tin Market Outlook 2024: Supply Tightness, Demand Resilience, Price Support

    Supply tightened sharply through 2024

    2024 was the year tin’s structural supply problem became impossible to ignore. Indonesia — historically 25–30% of world refined tin supply — saw refined exports collapse to roughly 46,000 metric tons, the lowest in more than two decades, as export permits tightened. Myanmar’s Wa State, which had supplied close to a tenth of the world’s mined tin, remained under the mining suspension imposed in 2023. With high-grade alluvial deposits depleting, mine supply struggled to keep pace.

    Demand stayed resilient

    Around half of tin demand comes from solder — the backbone of every printed circuit board — which keeps the metal tied to global electronics output. On top of that base, tin’s role in photovoltaic ribbon for solar panels and across battery supply chains continued to grow through 2024, adding an energy-transition dimension that makes tin demand far less discretionary than a pure electronics read would suggest.

    2024 Snapshot
    ~46,000 MT
    Indonesia refined tin exports, 2024 (20-year low)
    25–30%
    Indonesia’s share of world refined tin
    ~50%
    Share of tin demand from solder
    ~10%
    Global mine supply paused by Myanmar’s Wa State

    Prices found support

    The combination of constrained supply and resilient demand kept a floor under tin prices through 2024, with low exchange inventories amplifying every supply scare. For physical buyers, the lesson of the year was that securing reliable tonnage mattered more than timing the market.

    What it meant for buyers

    2024 underlined the case for diversifying origin away from single-country dependence. For buyers of tin concentrate (cassiterite), working with a principal trader that holds vetted producer relationships and ships with independent SGS or Alex Stewart inspection became a practical hedge against a tightening market. For a deeper look at where reliable supply now sits, see our tin concentrate sourcing analysis and our country-risk map for critical minerals buyers.

    FAQs

    Why did tin prices hold up in 2024?

    A structurally tight supply base — collapsing Indonesian exports and Myanmar’s paused Wa State mines — met resilient demand from solder and growing solar/EV use, with low exchange inventories amplifying every shock.

    What is tin concentrate (cassiterite)?

    Cassiterite is the principal tin ore, typically supplied at 40–70% Sn, which is smelted into refined tin. It is the form most physical buyers and smelters source.

    How can buyers secure reliable tin supply?

    By diversifying across multiple vetted origins rather than a single country, and shipping every cargo with independent third-party inspection and full documentation.

  • Jebel Ali, Fujairah, or Khor Fakkan? A Buyer’s Cost Comparison for UAE Bunkering

    Jebel Ali, Fujairah, or Khor Fakkan? A Buyer’s Cost Comparison for UAE Bunkering

    The three UAE bunkering options are not interchangeable. Fujairah is the global benchmark, the third-largest bunker hub in the world, and the default for transit voyages. Jebel Ali is the port-of-call advantage when your vessel is loading or discharging cargo in Dubai. Khor Fakkan has anchorage capacity that has become significant since Red Sea diversions began. Which one to use depends on voyage economics, lay-can flexibility, and what you are paying for in the BDN. This is the working comparison Au Club’s bunker desk uses with charterers.

    Market Snapshot
    3
    UAE bunkering ports compared
    #3
    Fujairah global bunker hub rank
    24–72h
    Spot order lead time
    Platts UAE
    Pricing benchmark

    The three-port picture

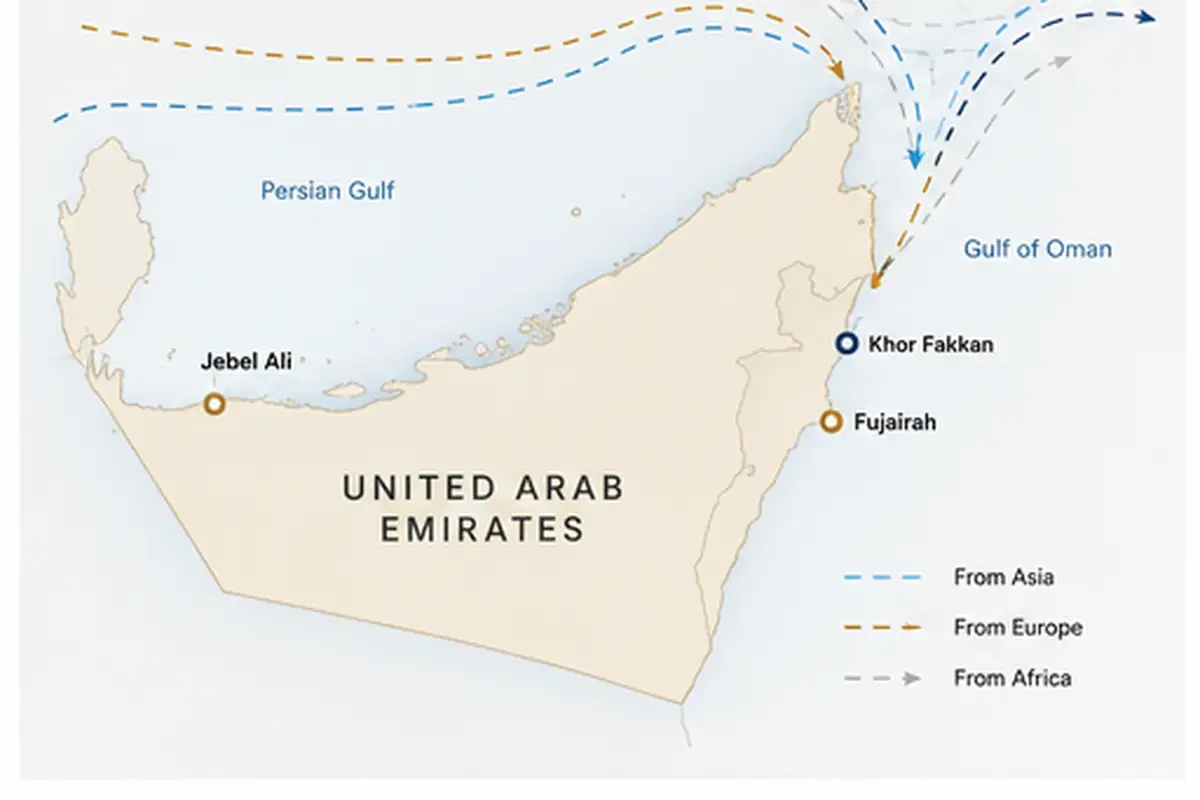
    Map of UAE showing Fujairah, Khor Fakkan, and Jebel Ali bunker ports

    Three Emirates serve the UAE bunker market. Each has its own physical infrastructure, supplier mix, and trading reputation.

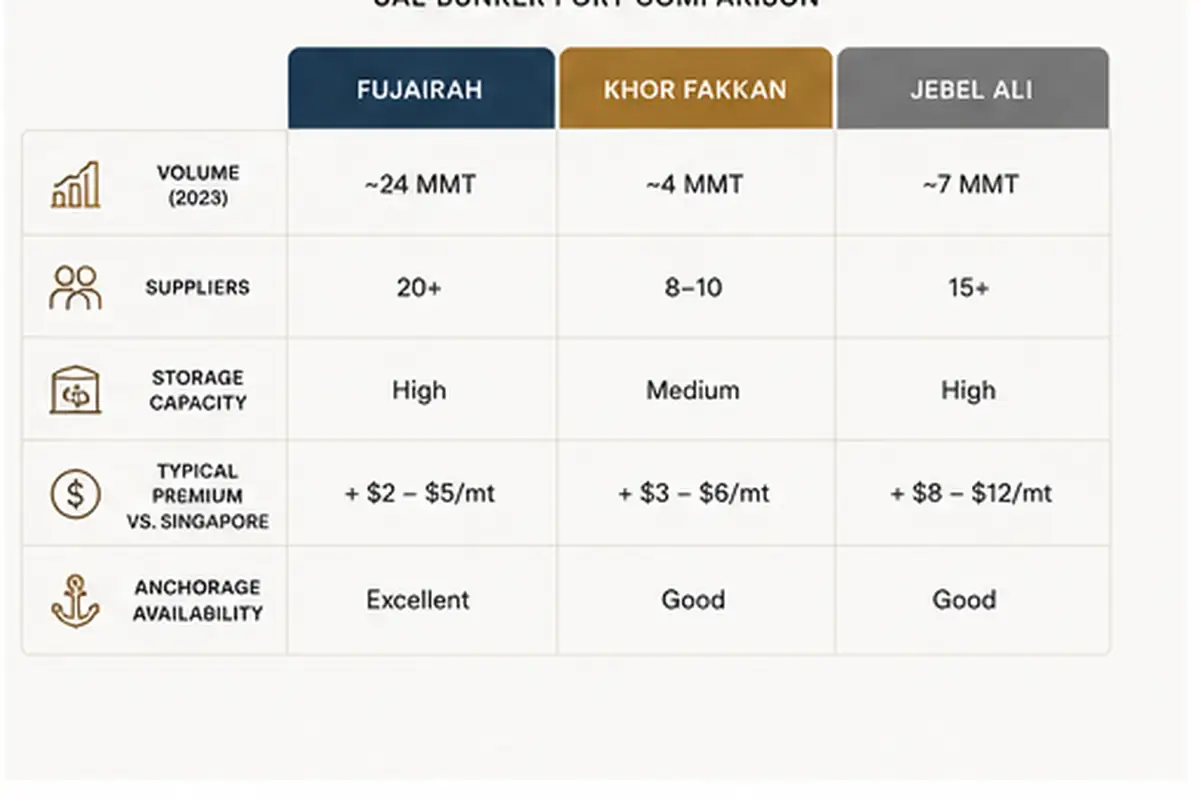
    Port

    2023 bunker volume

    Coast

    Storage operators

    Physical suppliers (approx)

    Notes

    Fujairah

    ~32 million MT

    East (Gulf of Oman)

    Vopak Horizon, Concord, ENOC

    35+

    World #3 bunker hub. Open ocean anchorage.

    Jebel Ali

    ~3 million MT

    West (Persian Gulf)

    ENOC, DP World tank farms

    8-10

    Port-of-call bunkering. Inside the Gulf.

    Khor Fakkan

    ~1 million MT

    East (Gulf of Oman)

    Limited landside storage

    4-6

    Anchorage and container terminal.

    The headline difference is volume. Fujairah moves around ten times the bunker tonnage of Jebel Ali. Its storage capacity, supplier count, and supplier competition make it the price-setter for the region. The Platts FOB UAE / Fujairah marker is what nearly every bunker invoice in the Middle East references, directly or indirectly.

    Why Fujairah is the regional benchmark

    Three structural reasons:

    Geography. Fujairah sits on the Gulf of Oman, outside the Strait of Hormuz. A vessel transiting between Asia and Europe via Suez does not need to enter the Persian Gulf to bunker at Fujairah. That saves up to 36 hours of steaming versus Jebel Ali for a vessel that is otherwise transiting.

    Storage depth. Vopak Horizon Fujairah alone holds approximately 3.5 million m³ of liquid storage. Concord, ENOC, and several other operators bring the total well above 10 million m³. This is what lets the port absorb supply-chain shocks that would dry out a smaller hub.

    Supplier competition. With 35+ physical bunker suppliers, the spread between the highest and lowest offer on any given day is typically $5-15 per MT for VLSFO. That is the cheapest discovery process in the region.

    The Platts FOB UAE VLSFO marker, the Fastmarkets Fujairah VLSFO assessment, and the Ship & Bunker Fujairah index all reference physical deals concluded into the port’s anchorage.

    When Jebel Ali makes sense

    Jebel Ali is the right answer when:

    • Your vessel is loading or discharging cargo at Jebel Ali Port or DP World terminals on the same call. The bunker stop is incremental, not a detour.
    • You need ultra-low sulphur fuels or specific grades that Fujairah’s bid-stack does not show that day.
    • Your charter party requires a UAE west-coast bunker for cargo-specific reasons (some FOB sale contracts specify Jebel Ali load).
    • You want simpler port formalities — DP World’s integrated agency handles the bunker stem alongside cargo operations.

    Pricing at Jebel Ali typically runs $2-8 per MT above Fujairah VLSFO. The premium reflects supplier concentration (fewer competing barges) and tighter storage. For a ship already inside the Gulf, that premium is more than offset by the avoided detour fuel and time.

    Khor Fakkan after the Red Sea diversion

    Khor Fakkan’s role changed in 2024. As Cape of Good Hope diversions pulled Asia-Europe vessels off the Bab-el-Mandeb route, the port’s anchorage became attractive for vessels staging eastbound or westbound voyages without entering Fujairah’s congested approaches.

    Khor Fakkan does not have Fujairah’s storage depth. Bunker barges shuttle product from Fujairah and from ENOC storage. The premium over Fujairah VLSFO runs $3-10 per MT, and the supplier count is small. The advantage is anchorage availability and reduced barge wait when Fujairah is congested.

    For a transit vessel that values certainty of slot over price, Khor Fakkan in 2024-2025 has been the contingency option.

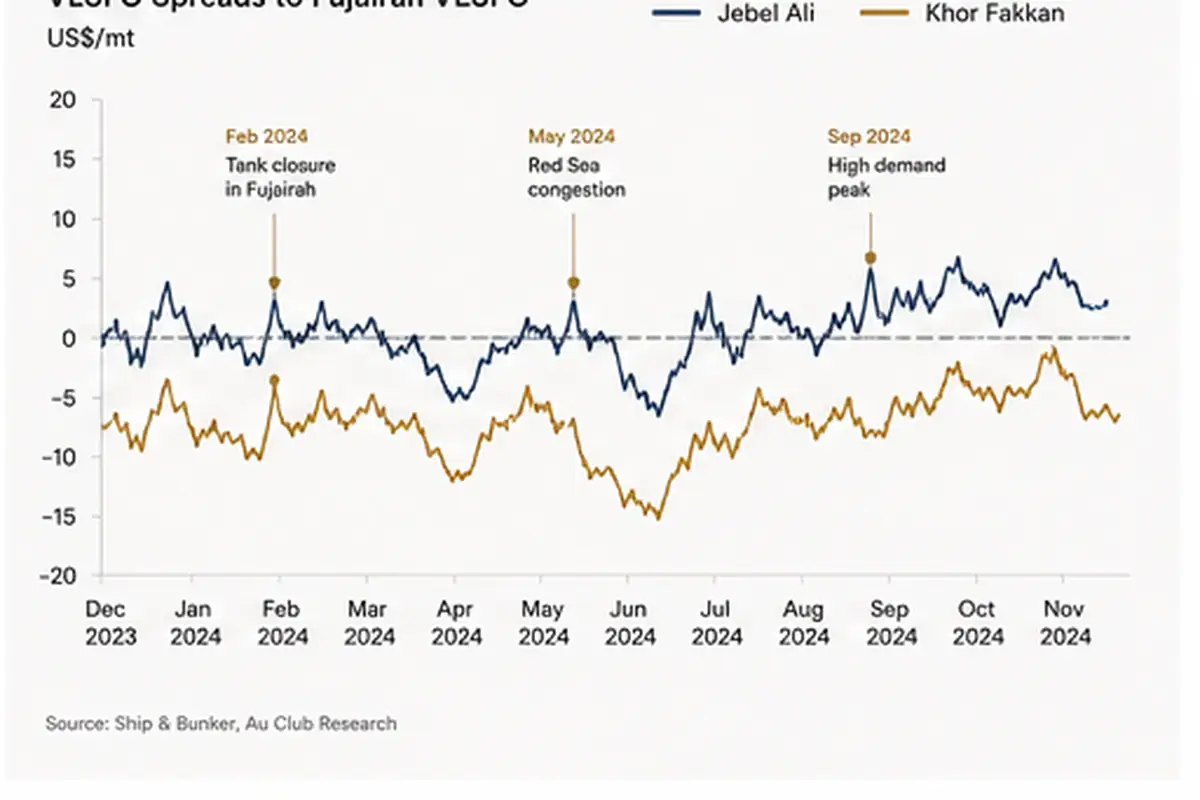
    Price spreads — what the 12-month rolling shows

    12-month VLSFO price spread chart Jebel Ali and Khor Fakkan versus Fujairah

    Twelve-month rolling pattern for the three ports against Fujairah VLSFO as the reference:

    Port pair

    VLSFO spread (USD/MT)

    Typical driver

    Jebel Ali – Fujairah

    +$2 to +$8

    Supplier concentration, barge availability

    Khor Fakkan – Fujairah

    +$3 to +$10

    Re-supply via Fujairah, smaller bid-stack

    Singapore – Fujairah

    +$5 to +$25

    Asia demand premium

    Rotterdam – Fujairah

    -$10 to +$10

    West/East arbitrage

    The Fujairah / Singapore spread is the most-watched. When it is negative (Fujairah more expensive), Gulf bunker demand is pulling barrels east. When it is positive by more than $15/MT, traders are arbing product west into the Middle East. The Au Club desk monitors this spread daily for our voyage chartering customers.

    What to insist on in the BDN

    The Bunker Delivery Note is the document that matters when there is a dispute. Five lines to check on every UAE bunker stem:

    1. ISO 8217:2024 specification compliance — confirms the fuel meets sulphur, viscosity, density, sediment, and stability parameters. Insist on the 2024 revision.
    2. Sulphur content — for VLSFO, ≤0.50% m/m. Sample sealing and chain of custody documented.
    3. Density at 15°C — affects mass-to-volume conversion. Confirm the meter reading and the lab figure.
    4. Sample sealing in the presence of Chief Engineer and supplier representative — four samples (ship retain, supplier, MARPOL, independent). Without this you have no dispute path.
    5. Quantity verification by tank gauging plus volumetric meter — both methods, signed by both parties. The most expensive bunker disputes are quantity disputes.

    The MARPOL sample is the legally significant one. It is the sample tested if the port-state control inspector challenges your sulphur compliance. Keep it sealed for at least twelve months.

    Buyer’s checklist before you stem

    Before you send the bunker requirement to a supplier or to Au Club:

    • Vessel name, IMO, flag, last port, next port
    • Grade required (VLSFO 0.5% S, HSFO 3.5% S, MGO DMA)
    • Quantity (with min/max tolerance, usually ±5%)
    • Lay-can (earliest/latest delivery dates)
    • Payment terms (typical UAE bunker terms: 30 days net from BDN)
    • Discharge port if relevant (affects route economics)
    • Charter party clauses you need the bunker stem to honour (Cl.1 specifications, MARPOL Annex VI compliance)

    The faster the requirement reaches the desk in standard format, the better the price discovery. A nine-line requirement that includes all the above will close in under two hours. An incomplete enquiry will take a day and end with a worse price.

    Au Club’s role

    Au Club supplies VLSFO (0.5% S) and HSFO (3.5% S) at Jebel Ali, Port Khalifa, Fujairah, and Khor Fakkan. We work with multiple physical suppliers at each port, which gives our charterer clients price discovery across the available bid-stack rather than a single supplier’s pricing. ISO 8217:2024 compliant. Full BDN documentation. Sample sealing and laboratory testing through SGS or Intertek where requested.

    To request a quote, send the nine-line requirement to our bunker desk. Response time within two business hours.

    FAQs

    Which UAE port is cheapest for VLSFO?

    Fujairah, in almost every twelve-month window. The supplier count and storage depth produce the tightest bid-stack. Jebel Ali typically runs $2-8/MT above Fujairah; Khor Fakkan $3-10/MT above.

    Can I bunker at Khor Fakkan without staging via Fujairah?

    Yes, but the supplier count is small. For predictable supply, Fujairah is the safer choice unless anchorage congestion at Fujairah is the binding constraint.

    What is the difference between Port Khalifa and Fujairah for bunkering?

    Port Khalifa (Abu Dhabi) is a smaller bunker market focused on local supply. Fujairah is the regional benchmark. Au Club covers both.

    Are scrubber vessels welcome at all three ports?

    Open-loop scrubber discharge is permitted in UAE waters (unlike Singapore and parts of EU). Closed-loop and hybrid systems are unrestricted. All three ports stem HSFO.

    About Au Club

    Au Club is a Dubai-based commodity trader supplying marine fuel at Jebel Ali, Port Khalifa, Fujairah, and Khor Fakkan. VLSFO 0.5%, HSFO 3.5%, MGO DMA. ISO 8217:2024 compliant. Request a bunker quote at our website.

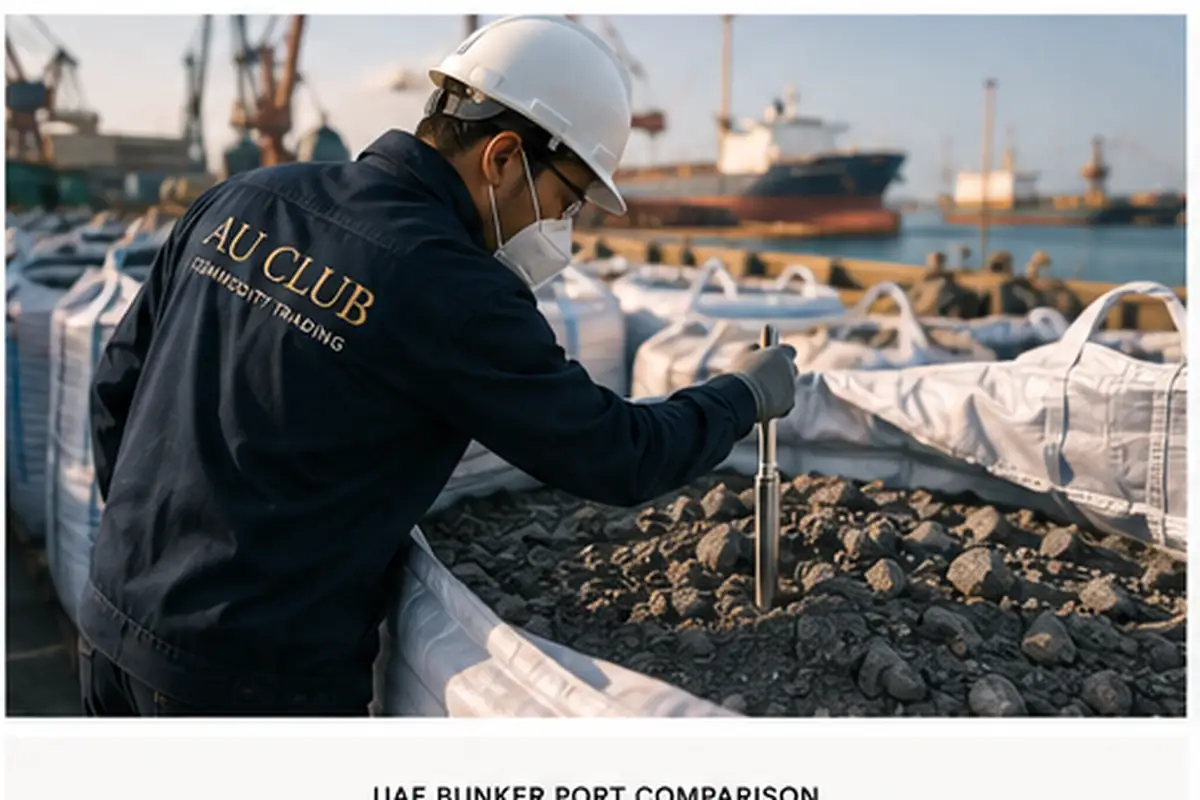
    Side-by-side comparison of UAE bunker ports — volume, suppliers, premium

    Sources & further reading

  • Antimony Shock: Why Prices Just 27x’d in Sixty Days

    Antimony Shock: Why Prices Just 27x’d in Sixty Days

    Antimony went from $1,400 per metric ton in July 2024 to $38,000 per metric ton by mid-September. That is not a price move. That is a market structure change. If you buy antimony oxide for flame retardants, antimony trioxide for PVC stabilisers, or antimony concentrate for lead-acid batteries, the contract you signed in May 2024 no longer means what it meant when you signed it. This is what happened, why the price will not snap back, and how to rebuild your antimony supply book around it.

    Market Snapshot
    $1,400 → $48,000
    Antimony price Jul → Nov 2024
    27×
    60-day price multiplier
    -97%
    Chinese exports YoY (Sep 2024)
    48%
    China share of world mine output

    What changed on 14 August and 15 September 2024

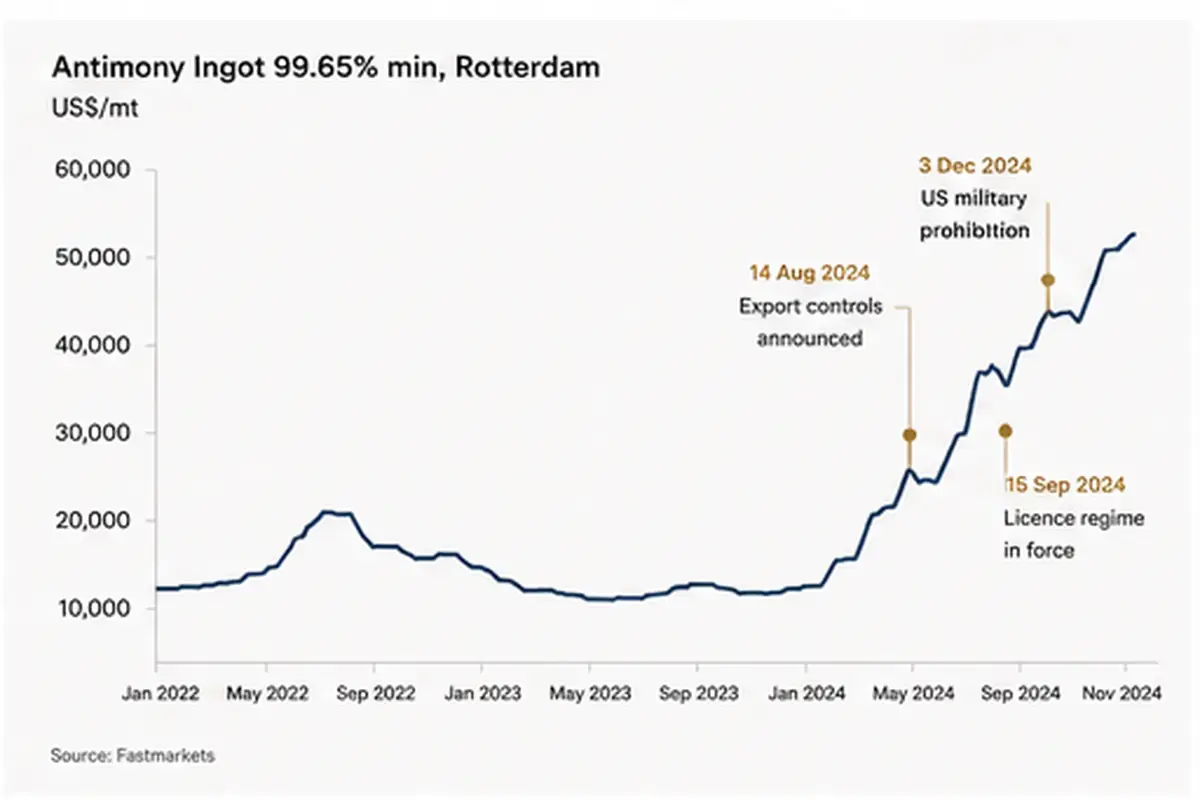
    Antimony price chart July to November 2024 showing rise from $1,400 to $48,000 per MT

    On 14 August 2024, China’s Ministry of Commerce (MOFCOM) and the General Administration of Customs published Announcement No. 33: antimony and a range of antimony compounds were added to China’s dual-use items export control list. The licence regime took effect on 15 September 2024. From that date, any Chinese exporter of antimony or antimony products had to obtain individual export licences from MOFCOM, with end-user disclosure, end-use justification, and supporting documentation.

    On 3 December 2024, MOFCOM tightened the screw a second time: a full prohibition on exports of antimony products to United States military end-users, or for military end-uses.

    The mechanism reads like a licensing regime. The practical effect has been a near-total halt in Chinese antimony export flow. Chinese antimony exports for September 2024 fell by approximately 97% year-on-year. October and November showed marginal recovery. MOFCOM has approved very few applications publicly. The Chinese authorities have not articulated criteria.

    Why this is a structural problem, not a price spike

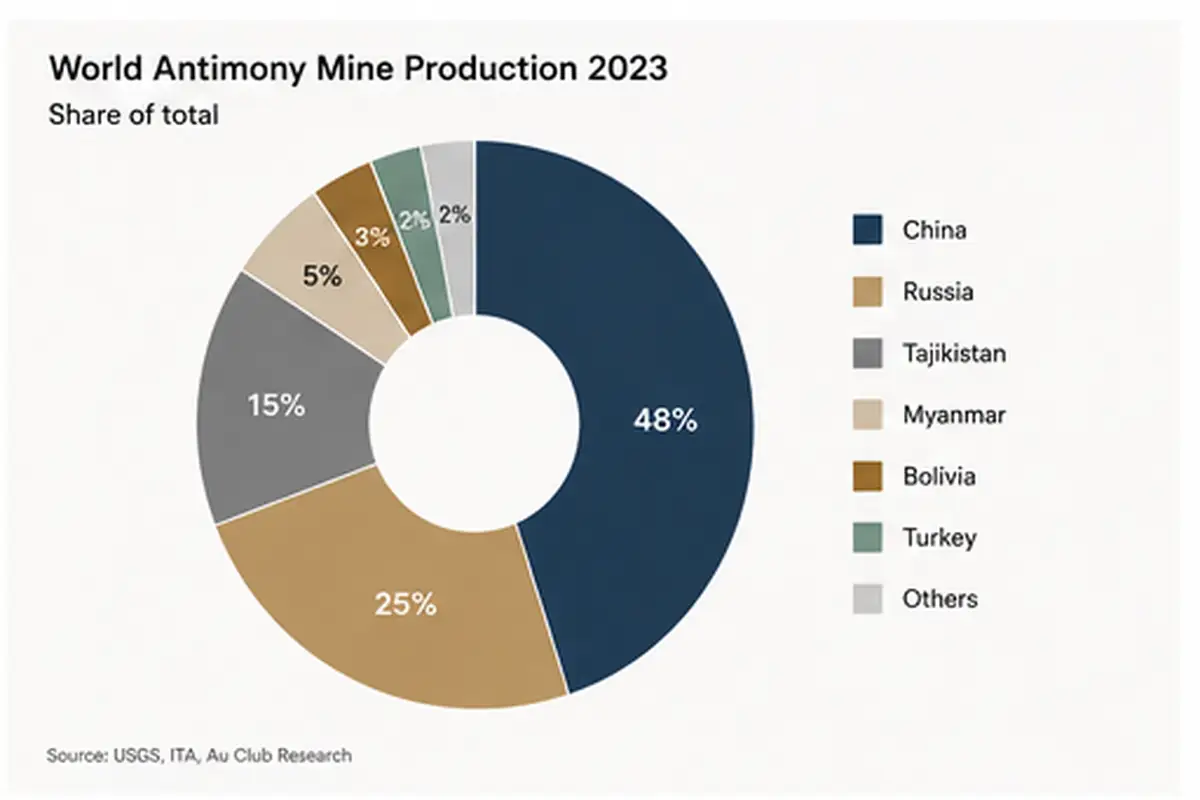
    Donut chart of world antimony mine production by country, China dominant at 48%

    Antimony is mined in fewer than fifteen countries at commercial scale. China accounts for roughly 48% of world mine production. Russia is next at around 25%. Tajikistan is third at approximately 15%. Bolivia, Myanmar, Turkey, Australia and a handful of others make up the balance.

    China’s dominance is amplified at the refining stage. Chinese smelters refine not only Chinese ore but also Russian, Burmese, and Tajik concentrate. The world’s tradeable antimony — antimony metal, antimony trioxide, antimony tri-sulphide — has moved through Chinese smelters even when the ore itself originated elsewhere.

    This is why the price went where it did. The market did not just lose 48% of supply. It lost the refining and trading infrastructure that aggregated the other 52%.

    Antimony price path, July–November 2024

    Month

    Price (USD/MT, FOB Asia)

    Move

    July 2024

    $1,400

    Base

    August 2024

    $22,000

    First licence rumour priced in

    Mid-September 2024

    $38,000

    Licence regime in force

    October 2024

    $44,500

    Stocks drawn

    November 2024

    $48,000

    Spot in Rotterdam

    By early 2025 the metal traded at $51,500 per metric ton. Fastmarkets has been assessing antimony prices since the 1980s. It has never seen this kind of move.

    Where antimony is consumed — and why substitution is harder than it sounds

    Antimony value chain diagram from mine to end use

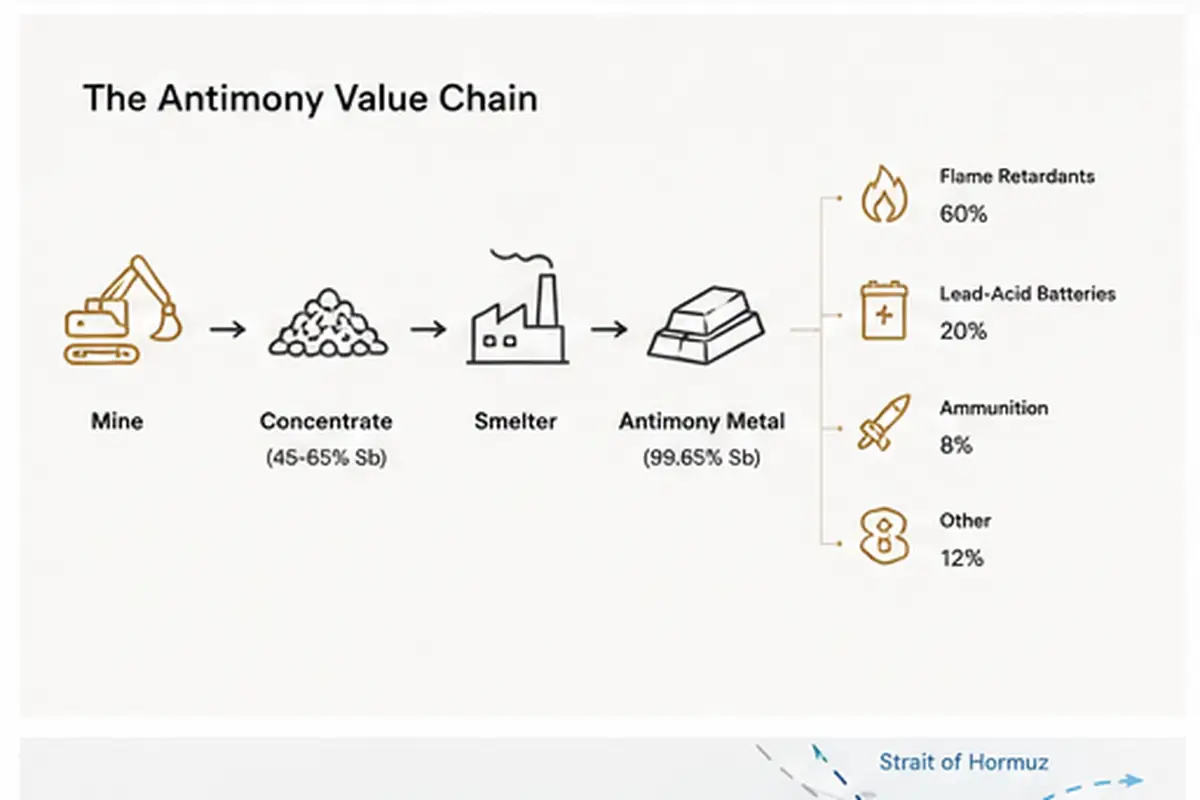
    Around 60% of refined antimony goes into flame retardants — chiefly antimony trioxide (Sb₂O₃) used in PVC, ABS, polyester resins, electronics housings, electrical cable jacketing, and textile back-coatings. Approximately 20% goes into lead-acid batteries, where antimony is alloyed with lead to harden battery plates. The remainder is split between ammunition primers, glass fining, catalysts, and a small but strategically important share in solar photovoltaic glass.

    Substitutes exist for some applications:

    • Flame retardants — phosphorus-based and halogen-free alternatives can substitute in some polymer systems, but reformulation requires UL recertification, supplier audits, and a six-to-twelve month qualification cycle.
    • Lead-acid batteries — calcium-alloyed plates already dominate the starter-battery market, but deep-cycle and stationary applications still rely on antimonial lead.
    • Ammunition — no commercially viable substitute exists for antimony in primer compositions and shot hardening.

    The result: industrial flame retardant buyers cannot meaningfully reduce their antimony exposure inside a twelve-month window. Battery manufacturers can only partially. The defence supply chain has no substitute path at all. That is why the December 2024 military-end-use prohibition matters — it forces Western defence procurement to find non-Chinese, non-Russian antimony at a moment when neither is reliably available.

    The non-China supply map

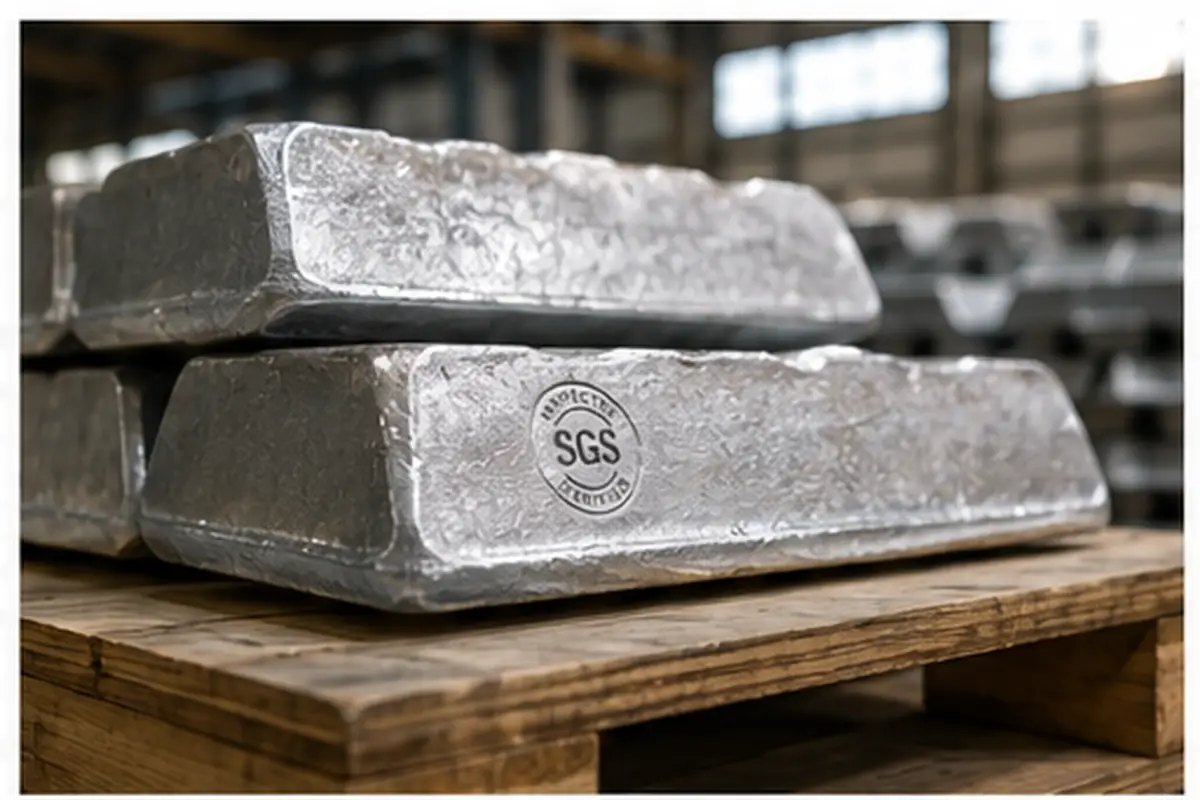
    Inspector sampling antimony concentrate at port warehouse

    Au Club’s working view of the non-China antimony supply universe in late 2024:

    • Tajikistan — the Anzob mine and Konimansur deposit. Output is captive to Russian-aligned offtakers in practice. Commercial availability for Western buyers is limited and the routing complexity is high.
    • Russia — Polyus and other producers. Sanctioned for direct sale into the US and UK markets after April 2024. Triangulation possible through third countries but creates origin documentation risk.
    • Bolivia — small-scale producers. Sb concentrate of 45-60% Sb is the working grade. Logistics through Arica, Chile or the Pacific via Iquique. Volumes are small relative to demand but the origin is clean.
    • Myanmar — informal mining and smelting. Significant volume historically flowed into Chinese refineries. Direct export to non-Chinese buyers exists but quality and documentation are inconsistent.
    • Turkey — small mine production. Domestic consumption absorbs most of it.
    • Australia — Hillgrove (NSW) restarted production planning. First commercial concentrate flow expected late 2025 / early 2026.

    Au Club’s offer covers antimony concentrate (45–65% Sb) and antimony ingots, with 100-300 MT/month availability through non-Chinese routes. We do not handle Russian-origin material.

    How to write a 2025 antimony contract

    If your existing contracts use Fastmarkets China Sb 99.65% as the benchmark, that benchmark may not have a meaningful market behind it for non-China material. Three contractual considerations matter more than they used to:

    1. Origin clause — explicit identification of the country of mining and country of smelting. “Non-Chinese, non-Russian origin” is the most common Western buyer requirement post-December 2024.
    2. Price formula — a floating reference against Fastmarkets Antimony Ingot 99.65% Rotterdam, with an explicit premium for confirmed origin, is now the dominant structure for non-China material.
    3. Force majeure — should explicitly include export licence withdrawal, host-country export quotas, and shipment delays caused by sanctions screening. Generic FM language drafted before August 2024 is not sufficient.

    Pre-shipment inspection should be by SGS, Alex Stewart, or Intertek with a Certificate of Analysis covering Sb, As, Pb, Bi and S content. The COA, the certificate of origin, and the bill of lading should travel as a single document set under any LC.

    Au Club’s read for 2025 and 2026

    The licence regime is not going to be quietly lifted. Antimony’s pricing in 2025 will be set by the cleared-licence flow from China — likely small, unpredictable, and bid-up by defence buyers — against rising non-China supply from Tajikistan, Bolivia, and eventually Hillgrove. Our working range for Fastmarkets Antimony Ingot 99.65% Rotterdam through 2025 is $42,000 to $58,000 per MT.

    What we are telling buyers: lock 12-month supply now, accept a higher annual average than 2023, and structure the contract so origin documentation moves with the cargo. For 2026, plan for a market that has structurally re-priced. There is no version of this story where antimony returns to $1,400.

    FAQs

    Is antimony still banned from China?

    Antimony is not banned. It is under a dual-use export licence regime introduced 15 September 2024. MOFCOM approves licences case by case. Export volumes since September 2024 have been a small fraction of historical levels. A specific prohibition exists, since 3 December 2024, on exports to US military end-users.

    What is the antimony price today?

    At time of writing in November 2024, Fastmarkets Antimony Ingot 99.65% Rotterdam was assessed around $48,000 per MT. For real-time pricing, contact our trading desk.

    Where else can I buy antimony concentrate?

    Tajikistan, Bolivia, Myanmar, Turkey, and (from late 2025) Australia. Au Club sources from non-Chinese, non-Russian origins and supplies 45-65% Sb concentrate plus ingots, 100-300 MT/month.

    About Au Club

    Au Club is a Dubai-based commodity trading company supplying marine fuel, metals, and minerals worldwide. We trade antimony concentrate and antimony ingots from non-Chinese origins, with SGS or Alex Stewart pre-shipment inspection and full documentation. To enquire about availability and pricing, contact our trading desk.

    Sources & further reading