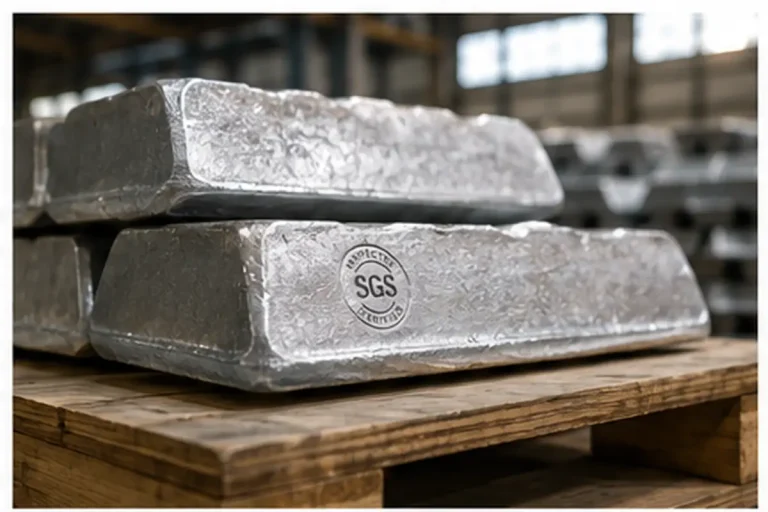
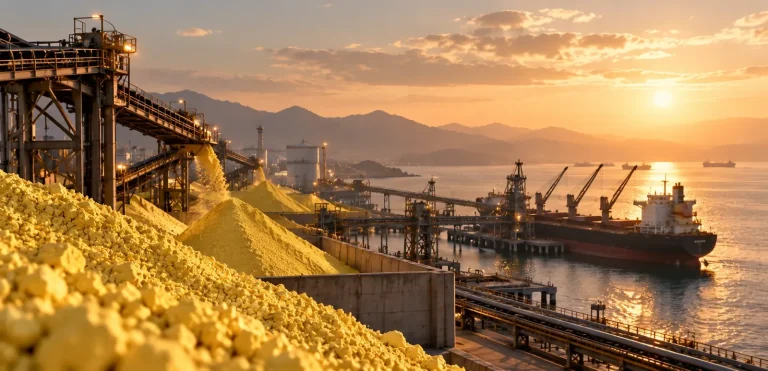
Tin pushed toward $50,000 per ton in 2026, up around 70% on the year. The supply squeeze gets the headlines. The quieter story is on the demand side — and it runs straight through the AI build-out.
Around half of all tin consumed goes into solder, and solder is what holds electronics together. Every server, every chip on a board, every power module and networking switch in a data centre is joined with tin-based solder. When the hyperscalers commit to spending, tin demand is downstream of that decision whether anyone names the metal or not.
The numbers behind the move
Metric
2026 reading
Tin price
~$50,000/MT, up ~70% year-on-year
H1 2026 average
~$45,000/MT (+40% YoY)
Solder share of demand
~50% of global tin consumption
Refined supply growth 2026
~+3%
Demand growth 2026
~+3.5% — market tips into deficit
First deficit since
2021
Supply from unstable regions
~60% of global production
Why AI is a tin story
The link is indirect, which is exactly why it is underpriced. AI does not consume tin directly. AI consumes servers, and servers consume solder. Major cloud providers have announced data-centre capital expenditure running past $100 billion a year through 2026. That spending lands as racks of hardware, and every board in those racks is soldered.
Crucially, data-centre build-out is additive demand. It sits on top of the ordinary replacement cycle for phones, cars, and consumer electronics rather than replacing it. So at the very moment supply is struggling, a large new layer of demand has been switched on — one tied to multi-year capex commitments, not a seasonal upgrade. That is what turns a tight market into a deficit.
And supply cannot answer quickly
Refined production is expected to grow about 3% in 2026, short of roughly 3.5% demand growth. The result is the first deficit since 2021. The reason supply cannot simply ramp is geography: around 60% of global tin output comes from politically unstable jurisdictions, and the two swing sources are both impaired.
Myanmar. The Wa State mining ban imposed in August 2023 took out a huge slice of feed to Chinese smelters. The core Man Maw area — roughly 80% of Myanmar’s supply — has been largely suspended, and Myanmar’s share of China’s imports fell to around 24–30% in 2025. The International Tin Association reports shipments are set to resume as operators secure new three-year permits, but a restart is not the same as full output.
Indonesia. Exports keep being throttled by delays in approving annual work permits, making the world’s largest exporter an unreliable swing producer.
DRC. The Democratic Republic of Congo became China’s largest tin concentrate supplier in early 2025, with its import share rising to around 28%. Supply growth there is real but constrained, and security risk is ever-present.
The Gulf angle worth noting
There is a Gulf thread in the tin supply story that is easy to miss. Abu Dhabi’s sovereign wealth interests took majority ownership of Alphamin, the operator of the Bisie mine in the DRC and one of the most significant non-Asian tin producers. Combined with US-brokered security arrangements in the region, that signals rising institutional confidence in a jurisdiction that now sits near the centre of global tin supply — and it puts Gulf capital directly into the metal’s future.
What this means for buyers
For anyone consuming tin or tin concentrate, the demand-side story changes how you should think about price risk. This is not a spike waiting to mean-revert; it is a structural deficit met by impaired supply, with a new and committed buyer in the data-centre sector. The downside case requires either an AI capex pause or a clean supply restart in Myanmar and Indonesia at the same time — possible, but not the base case.
Assume the floor is higher. Solder demand is sticky and growing. Budget for tin holding well above the old comfort range.
Diversify origin. With 60% of supply in unstable regions, concentration is the real risk. Spread across producers and document origin.
Contract on a benchmark, not a fixed price. Volatility is too high for long fixed-price deals; use an LME-referenced formula with origin and volume flexibility built in.
How Au Club helps
Au Club trades tin concentrate with inspected, documented origin and the flexibility to source across multiple producing regions rather than a single point of failure. We structure spot and term supply, FOB UAE, with SGS or equivalent inspection on every cargo, LC and TT accepted. For buyers exposed to the electronics and data-centre demand wave, the desk can help build an origin-diversified book and contract structure that survives a volatile market.
FAQs
Why is tin rising so fast?
A structural supply deficit meets new, additive demand from data-centre and AI hardware build-out — all of which is assembled with tin solder.
How much tin does electronics really use?
Solder is roughly half of all tin demand, and it is the dominant use in semiconductors and electronics assembly.
Will Myanmar supply coming back end the deficit?
A restart helps, but a phased resumption under new permits is unlikely to fully close a deficit that demand growth keeps widening in 2026.
Where does Au Club source tin concentrate?
Across multiple producing regions, with inspected origin documentation and origin flexibility for buyers who need it.
About Au Club
Au Club is a Dubai-based commodity trading company supplying marine fuel, metals, and minerals worldwide. We trade tin concentrate with SGS or equivalent pre-shipment inspection and full origin documentation, FOB UAE. To enquire about availability and pricing, contact our trading desk.
Antimony traded near $51,800 per metric ton at the end of May 2026. Eighteen months ago we wrote that prices had risen 27-fold; the question now is not whether the spike was real, but where the market settles.
Market Snapshot
~$51,800
Antimony price, end May 2026 ($/MT)
-22%
vs start of 2025 — but far above pre-2024
~4×
China domestic vs Western price gap (2025)
11% → 39%
Solar share of antimony demand, 2021 → 2026
When we last covered antimony in November 2024, the metal had gone parabolic. Western spot prices climbed through $39,500 per ton by the end of 2024 and pushed to $50,000–$60,000 across the first half of 2025. That move was driven by one fact: China, which controls the majority of mined and refined supply, had moved antimony onto its export-control list. Buyers outside China scrambled, and the price did the rest.
A year and a half later the picture is calmer but not cheap. Prices have come off the 2025 highs, yet they sit far above anything seen before 2024. For buyers the practical question has changed. It is no longer how high this goes, but whether this elevated level is the new normal, and how to contract around it. Our read is that it largely is.
Where the price actually is
Antimony ended May 2026 around $51,800 per ton, down roughly 6% year-to-date and around 22% below where it sat at the start of 2025. In other words, the peak is behind us, but the floor has reset to a level that would have looked absurd two years ago. The metal has not given back its gains; it has consolidated.
Period
Western price ($/MT)
Driver
Early 2024
~$13,000–15,000
Pre-shock baseline
Dec 2024
~$39,500–40,000
China export-control shock prices in
Q1–Q2 2025
$50,000–60,000
Western scramble for non-China units; peak
End May 2026
~$51,800
Consolidation at elevated level
The two-price market is still here
The defining feature of this cycle is not the headline number, it is the split. Export controls opened a gap between what antimony costs inside China and what it costs everywhere else. Through 2025 Chinese domestic offers were reported as low as roughly $14,000 per ton while Western buyers paid $55,000–60,000 — close to a four-fold difference for the same metal.
That wedge is the single most important thing for a buyer to understand. It is not a pricing error; it is policy. Material is cheap where it cannot freely leave and expensive where it is needed. Most market participants expect the gap to narrow over the coming year as trade flows normalise and more raw material moves back into China, but narrowing is not closing. As long as the licence regime exists, origin and paperwork carry a premium.
China dialled back, but did not let go
There has been a genuine policy thaw. In November 2025 China’s Ministry of Commerce suspended its export ban on antimony — along with gallium and germanium — for shipments to the United States, with the suspension running to late November 2026. That took some heat out of the panic.
The word that matters is suspended. A suspension with an expiry date is not a repeal. It is a window that can close again, and any buyer building a 2027 supply plan around Chinese material is building on a permission that has a clock on it. The smart reading is to treat current access as a convenience, not a foundation.
Why demand is not going to rescue buyers
Roughly half of antimony demand is still flame retardants, the traditional anchor. The change underneath is what the other half is becoming.
Solar glass. Antimony trioxide is a clarifying agent in solar cover glass. Consumption from the solar sector is forecast to reach around 68,000 tons in 2026, up from roughly 16,000 tons in 2021 — taking photovoltaics from about 11% of antimony demand toward 39%.
Defence. Antimony hardens lead for ammunition and is used in armour-piercing rounds, primers, and night-vision optics. The US Department of Defense alone specifies it across more than 200 types of ammunition.
This is the uncomfortable part for procurement. The two fastest-growing demand sources — the energy transition and national security — are both highly price-inelastic. A solar manufacturer or a defence prime does not stop buying because antimony is expensive; the metal is a tiny share of their finished cost and there is no substitute. They bid against each other for a metal that has been in structural deficit since 2022, while Chinese mined supply in 2025 ran roughly 24% below 2021 levels as its richest deposits deplete.
Where the alternative tons come from
The one piece of genuinely good news is that non-China supply is responding. Southeast Asian growth is expected to keep the global balance adequate in 2026, and buyers diversifying away from China have pulled more processed metal from Tajikistan, India, Turkey, Mexico, and across Southeast Asia. None of these individually replaces China, but together they give a buyer something to build a non-China book around — which two years ago barely existed.
Au Club’s read for the next 12 months
The spike is over; the re-rating is not. We do not expect antimony to return to pre-2024 levels. A $45,000–55,000 working range is the realistic base for 2026, with the floor reset structurally higher.
The two-price market persists. The China-versus-rest gap narrows but stays open while licences exist. Non-China origin keeps a premium worth paying for buyers who need supply security.
Treat Chinese access as borrowed time. The export-ban suspension expires in late 2026. Build 2027 plans on diversified, non-China origin and treat any Chinese flow as upside, not the base.
How Au Club helps
Au Club supplies antimony ingots and antimony concentrate with independently inspected, documented origin. For buyers serving solar, defence-adjacent, or other security-sensitive end markets, we can confirm non-Chinese origin and structure spot or term supply, FOB UAE, with SGS or equivalent inspection on every cargo. LC and TT accepted. Talk to the desk about locking 2026 volume and opening 2027 forward arrangements before the policy window changes again.
FAQs
Is antimony going to keep falling?
It has come off the 2025 peak, but our base case is consolidation in the $45,000–55,000 range rather than a return to old lows. The deficit and demand drivers remain intact.
Why is Chinese antimony so much cheaper?
Export controls trap cheaper material inside China while buyers outside pay a security premium. The gap is policy-driven, not quality-driven.
Can I still buy Chinese antimony?
For now, yes — the export-ban suspension runs to late November 2026. After that, access depends on policy. Plan for non-China origin as your base.
Where does Au Club source non-China antimony?
Across Southeast Asia and producers in Tajikistan, India, Turkey, and Mexico, with inspected origin documentation.
About Au Club
Au Club is a Dubai-based commodity trading company supplying marine fuel, metals, and minerals worldwide. We trade antimony concentrate and antimony ingots from non-Chinese origins, with SGS or equivalent pre-shipment inspection and full documentation. To enquire about availability and pricing, contact our trading desk.
Singapore moved 463,948 metric tons of LNG bunker fuel in 2024, up over four-fold from the year before. Global LNG bunker demand reached approximately 4 million MT in 2025, up 54% year-on-year. ADNOC and TotalEnergies added 18,000 m³ of floating LNG storage to Fujairah in early 2026, positioning the Gulf to intercept Asia-Europe trade lanes. On 1 March 2027 the IMO Net-Zero Framework enters force, applying carbon prices of up to $380 per ton CO₂e to vessels that exceed the GHG intensity target. The next three years are the bunker market’s transition window. This article maps where each alternative fuel actually stands, what Fujairah’s role becomes, and how operators should be planning bunker strategy for 2027 and beyond.
Market Snapshot
463,948 MT
Singapore LNG bunker (2024)
4×
LNG bunker growth year-on-year
+54%
Global LNG bunker demand YoY 2025
18,000 m³
ADNOC/TotalEnergies LNG storage at Fujairah
The four alternatives, and where each stands
Operators have four credible non-conventional fuel paths. Each is at a different point on the readiness curve:
The numbers shift quickly. LNG’s lead is substantial — 1,500+ vessels in service or on order — but methanol orders accelerated through 2024-2025 as Maersk, CMA CGM, and Hapag-Lloyd commissioned dual-fuel methanol new-builds. Biofuel is the easiest transition path for existing vessels because it can blend with VLSFO and HSFO without machinery modification.
LNG: the dominant alternative for the next 5-10 years
LNG bunker demand grew from approximately 2.6 million MT in 2024 to about 4 million MT in 2025 — a 54% increase. Singapore’s growth has been the most striking: from 111,000 MT in 2023 to 463,948 MT in 2024, with 401,200 MT in the first three quarters of 2025 alone (heading for a similar full-year volume).
The supply chain has built out:
Singapore. The world’s largest bunker hub. Multiple LNG bunker vessels operate. December 2024 MPA Expression of Interest seeking scalable solutions for sea-based LNG reloading. Singapore is positioned to remain the global LNG bunker leader.
Rotterdam. Established LNG bunker capacity. Northern European hub for the Asia-Europe lane.
Yokohama and northern Asian ports. Growing capacity. Japanese and South Korean ports moving to commercial LNG bunkering.
Zeebrugge. Significant LNG terminal capacity. Belgian bunker market growing.
Fujairah. ADNOC-TotalEnergies floating storage (18,000 m³) added in early 2026. Positioning to serve eastbound and westbound Asia-Europe routings.
A 14,000-TEU container vessel running on LNG produces approximately 20-25% less CO₂ than the same vessel on VLSFO on a tank-to-wake basis. On a well-to-wake basis (accounting for upstream methane slip and LNG production emissions), the saving is smaller — typically 15-20% — but still meaningful under the MEPC 83 framework.
Methanol: the alternative that catches up fast
Methanol production has scaled and the fuel can be made from multiple feedstocks. Three categories matter:
Grey methanol. Produced from natural gas. Cheapest, but minimal GHG benefit over conventional bunker fuel (the carbon savings depend on production process).
Blue methanol. Produced from natural gas with carbon capture. Meaningful GHG savings (40-70%) but limited commercial production.
E-methanol (green). Produced from CO₂ + renewable hydrogen. Largest GHG savings (90%+) but small commercial volume and high cost.
Maersk has been the most aggressive methanol adopter, with 25+ dual-fuel methanol vessels in service or on order. CMA CGM has signed up. Hapag-Lloyd and several others have followed. The maritime methanol fleet is small today but growing rapidly.
The MEPC 83 framework heavily favours methanol because of its well-to-wake GHG intensity. A Maersk-class methanol vessel running on green methanol generates significant Surplus Units that can be sold or transferred — making the economics work even at a higher fuel cost.
Biofuel: the path for the existing fleet
Biofuel blends (HFO + biodiesel, or VLSFO + biodiesel) are the simplest transition. Most modern vessels can burn B24 (24% biofuel) or B30 (30% biofuel) without major machinery modification.
B24 / B30 is operational at Singapore and Rotterdam. Singapore conducted the first commercial B100 (100% biofuel) bunker trial in 2022 and has scaled biofuel bunker sales meaningfully through 2024-2025. ISO 8217:2024 includes specifications for biofuel blends.
The carbon saving depends on feedstock and blend:
B24 with used cooking oil (UCO) feedstock: approximately 20-25% well-to-wake GHG saving
B30 with UCO: approximately 25-30% saving
B100 with UCO: 80-85% saving
Sustainable biofuel feedstocks are constrained. UCO supply is limited. Agricultural feedstocks (palm oil, soy) face sustainability scrutiny. The IMO MEPC 83 framework recognises only sustainable biofuels — the precise criteria are being refined.
For existing vessels facing the 1 March 2027 framework, biofuel blends are the most cost-effective compliance pathway. Operators can buy a biofuel blend at a premium and earn Surplus Units or avoid Remedial Units.
Ammonia: the longer-term path
Ammonia (NH₃) has zero direct CO₂ emissions on combustion. Made from renewable hydrogen plus nitrogen, it offers a near-complete decarbonisation pathway.
The 2025-2026 status:
A handful of ammonia-fuelled vessels are in service or commissioning
The order book for ammonia dual-fuel vessels grew through 2024-2025
Production capacity at scale (green ammonia from renewable hydrogen) is starting to come online in Saudi Arabia (NEOM Green Hydrogen Mega-Project), Oman, Australia, and Egypt
Bunker infrastructure is at pilot scale only
Practical commercial ammonia bunkering at scale is a 2028-2030 story. Significant safety, infrastructure, and crew-training challenges remain. For 2026-2027 planning, ammonia is a watching brief rather than an active option.
What Fujairah’s role becomes
Fujairah’s strategic position changes meaningfully over the next three years. The port has three structural advantages:
Geographical positioning. East of the Strait of Hormuz, outside the Persian Gulf, on the natural shipping lane between Asia and Europe / Africa / Africa-routed bunkering.
Storage depth. Vopak, Concord, ADNOC, ENOC, and others operate substantial liquid storage. The ADNOC-TotalEnergies floating LNG capacity (added early 2026) brings LNG into the bunker portfolio at scale.
Supplier competition. 35+ physical bunker suppliers create the tightest bid-stack in the Middle East region.
Fujairah’s working role in the transition:
Fuel
Fujairah role 2027 onwards
VLSFO / HSFO
Continued dominant supply hub for conventional bunker
LNG
Emerging hub via ADNOC-TotalEnergies; could absorb Asia-Europe LNG bunker demand
Biofuel blends
B24 / B30 entering the bunker portfolio through 2027-2028
Future consideration; NEOM and Oman green ammonia projects regional
The Gulf’s natural advantages for the alternative-fuel transition are real. Abundant renewable energy (solar in Saudi, UAE, Oman) supports green ammonia production. Established LNG infrastructure (Qatar, UAE) supports LNG bunker. The shipping lane between Asia and Europe runs past the door.
What an operator should do this quarter
Practical actions for an operator preparing for the 1 March 2027 framework:
Quantify current fleet exposure. Calculate annual bunker consumption, average GHG intensity, and projected MEPC 83 Remedial Unit cost at 2027 prices.
Identify the lowest-cost compliance pathway. For most operators of existing vessels, biofuel blends are the lowest-cost partial-compliance path. For new-builds, LNG or methanol dual-fuel.
Open relationships with multiple bunker suppliers. Auto-pilot single-supplier relationships need to expand. Au Club and other multi-fuel suppliers provide flexibility across grades.
Update charter parties. 2026 fixtures should include explicit clauses for bunker grade flexibility, RU cost allocation, and Surplus Unit ownership.
Plan vessel-level monitoring. MEPC 83 will require well-to-wake intensity measurement and reporting. Onboard fuel monitoring and IT integration with shore compliance teams is becoming standard.
Au Club’s read for 2027 and beyond
Three working positions:
VLSFO remains the largest single bunker grade through 2027. Total alternative-fuel bunker demand will likely exceed 6 million MT globally in 2027 but VLSFO will still dominate at 250+ million MT annually.
Fujairah grows materially as an LNG bunker hub. The ADNOC-TotalEnergies floating storage and the Gulf’s natural energy advantages make Fujairah a credible alternative to Singapore for LNG bunkering on Asia-Europe routings.
Biofuel blends become routine. By 2028, B24 / B30 blends will be available at most major bunker hubs as standard offerings. Operators not already in conversation with biofuel suppliers are behind the curve.
For procurement teams: 2026 is the year to qualify alternative-fuel suppliers, restructure bunker contracts, and validate vessel-level compliance pathways. 2027 is the year of actual implementation. Operators who wait will pay disproportionately for late-stage compliance.
FAQs
When does the IMO Net-Zero Framework enter force?
1 March 2027. The framework was approved at MEPC 83 (April 2025) and adopted at the extraordinary MEPC session in October 2025.
Should I order a new-build with LNG or methanol dual-fuel?
For most operator profiles in 2026, both options are viable. LNG has stronger near-term infrastructure; methanol has stronger long-term GHG positioning. The decision depends on trade lane (LNG strong for Asia-Europe; methanol strong for transatlantic), refuelling network expectations, and operator strategy on Surplus Unit generation.
Can I burn biofuel in my existing vessel?
Most modern vessels (built post-2000 approximately) can burn B24 or B30 blends without machinery modification. Higher blends may require modification. Consult engine manufacturer documentation and class society.
Is Fujairah bunkering LNG?
Yes, since the early 2026 commissioning of ADNOC-TotalEnergies floating storage. LNG bunker volume is small today but growing. Fujairah is positioning to be a regional LNG bunker hub by 2027-2028.
About Au Club
Au Club supplies VLSFO (0.5% S) and HSFO (3.5% S) marine fuels at Jebel Ali, Port Khalifa, Fujairah, and Khor Fakkan. We work with customers on multi-year supply structures that anticipate MEPC 83 compliance and the alternative-fuel transition. Contact our bunker desk to discuss 2027-2030 strategy.
Molybdenum in the US reached $50,265 per metric ton in June 2025. Chinese 45% molybdenum concentrate hit a record 4,600 CNY per ton-unit in early September 2025. Ferromolybdenum peaked at 293,000 CNY per ton. This cycle has familiar surface drivers — stainless steel demand, supply tightness — but three structural features make it different from any moly cycle of the past twenty years. This article walks through what is unusual, models 2026 base, bull, and bear scenarios, and explains how procurement teams should write next year’s contracts.
Market Snapshot
$50,265/MT
US Mo price (Jun 2025)
4,600
China Mo conc CNY/ton-unit (Sep 2025)
293,000 CNY
Ferromolybdenum peak
3
Structural cycle drivers
Where moly is consumed
Molybdenum has narrow but high-value end uses:
End use
Share of demand
Stainless steel (especially 316 grades, duplex)
~50%
Construction / structural steel (HSLA grades)
~20%
Tool and alloy steels
~10%
Superalloys (turbines, aerospace)
~7%
Catalysts (petroleum refining, chemicals)
~7%
Lubricants and other
~6%
Stainless steel is the dominant end use. Moly improves corrosion resistance — 316 stainless contains 2-3% moly and is the standard for marine, food-processing, pharmaceutical, and chemical-process equipment. Duplex stainless contains higher moly content and is used for aggressive corrosion environments (offshore oil and gas, desalination, pulp and paper).
The other notable user is the petroleum refining industry. Moly-based catalysts are used in hydrodesulphurisation (removing sulphur from fuels) and hydrocracking. Refinery catalyst demand correlates with global refinery capacity.
Recent price history
Mid-2024 to early 2026 has been a sustained uptrend:
Period
US moly price ($/MT)
Driver
Q2 2024
$32,000-35,000
Steady stainless demand
Q4 2024
$38,000-42,000
China export-control announcement (Feb 4, 2025) priced in early
Q2 2025
$48,000-52,000
Demand acceleration + supply tightening
Q3 2025
$51,000-55,000
Peak; Chinese concentrate record
Q4 2025
$48,000-52,000
Modest pullback
Q1 2026
$46,000-52,000 (working range)
Stable elevated
Chinese 45% moly concentrate at 4,600 CNY/MTU and ferromoly at 293,000 CNY/ton in September 2025 represent multi-year highs. Western and Chinese prices have moved in close correlation, with the Chinese export-control regime keeping a wedge open between the two.
What is structurally different about this cycle
Three features set the 2024-2026 moly cycle apart from prior cycles:
1. Half of the world’s moly is a by-product of copper
Approximately 50-55% of global moly is mined as a by-product of porphyry copper deposits. Codelco’s Chuquicamata, Freeport’s Grasberg and Cerro Verde, Antofagasta’s Centinela and Los Pelambres, Southern Copper’s Buenavista and Toquepala — these mines all produce significant moly as a co-product of copper.
This is structurally important. By-product moly supply is governed by copper economics. When copper prices are strong (as they have been in 2025), porphyry copper miners produce more — which means more moly. When copper prices are weak, porphyry production slows and moly supply tightens.
In normal cycles, moly demand and supply respond to moly economics. In this cycle, copper economics are pulling moly supply with them in unexpected ways. The 2025 copper price rise should have produced more moly. It did, but not as much as expected — because Chinese smelter pressure on copper concentrate kept some porphyry operators in cash-flow conservation mode.
2. Captive supply concentration is unusually tight
Of the non-by-product moly supply, a meaningful share is captive. Climax Molybdenum (Freeport subsidiary) operates the Henderson and Climax mines in Colorado, producing primary moly. China’s primary moly producers concentrate production for domestic use. The freely tradable global moly market is smaller than the production figures suggest.
When buyers like ATI, Outokumpu, Aperam, and Acerinox look for incremental supply, they compete for a relatively shallow tradable pool. That intensifies the price reaction to incremental demand.
3. The China export-control regime adds a wedge
The MOFCOM 4 February 2025 export-control notice placed moly on the dual-use items list along with tungsten, tellurium, bismuth, and indium. Chinese moly exports have continued under the licence regime — moly is less politically charged than antimony — but the licence-application friction has slowed cross-border movement.
The practical effect: a Chinese-Western price wedge has emerged. Western buyers pay a premium for non-Chinese moly. Chinese buyers (steel mills, chemical plants) source primarily from domestic supply. The arbitrage that would normally close this wedge has been reduced by licensing friction.
Demand-side: why stainless steel is structural this cycle
Stainless steel demand has been strong, and the drivers look durable:
Grid-scale electrification. Electric transmission infrastructure (high-voltage AC and DC transmission), substation equipment, and power-generation hardware use stainless steel extensively. The global electrification programme is producing sustained demand.
Hydrogen and chemical processing. Green hydrogen electrolysers, alkaline electrolysis equipment, and adjacent chemical processing infrastructure use high-grade stainless. Multi-billion-dollar electrolyser fleets are being built across Europe, the US, India, and the Middle East (including in Saudi Arabia and the UAE).
Aerospace. Both commercial aviation (recovering passenger traffic) and defence aerospace (escalating military procurement globally) drive demand for moly-bearing superalloys.
Desalination. Gulf state desalination capacity continues to expand. Reverse osmosis and multi-stage flash plants use duplex and super-duplex stainless extensively.
Lithium and battery chemicals. Lithium hydroxide processing, sulphate plants, and ammonia-based ammonia-water-electrolyte systems use moly-bearing alloys. New lithium chemicals capacity in Australia, Chile, and Argentina is driving demand.
The unusual feature: most of these demand sources are project-driven and long-cycle. They build out over years, not months. Stainless mills supplying these projects have multi-year order books. Moly demand from these projects is more visible than ordinary stainless demand.
2026 scenarios
Au Club’s working scenario framework for 2026:
Base case (60% probability)
Price range. US moly $42,000-52,000/MT. European moly oxide $20-25/lb Mo.
Drivers. Stainless steel demand continues at strong levels. China export licences flow at moderate pace. By-product copper supply ramps modestly. No major mine disruption.
Implications for buyers. Lock 12-month supply at current pricing. Multi-year contracts at modest premium are available.
Bull case for prices (25% probability)
Price range. US moly $55,000-65,000/MT.
Drivers. Significant additional supply restrictions from China (full export ban scenario). Major mine disruption at a key porphyry operation. Acceleration of hydrogen project demand.
Implications for buyers. Forward purchases at elevated levels become necessary. Stockpile becomes economic to hold.
Bear case for prices (15% probability)
Price range. US moly $32,000-42,000/MT.
Drivers. Chinese export-control regime relaxed in a broader US-China trade deal. Stainless steel demand falls in a global recession. New mine supply ramps faster than expected.
Implications for buyers. Defer forward purchases; buy spot.
How to write a 2026 moly contract
Three contract elements that matter:
1. Price formula. Most international moly oxide contracts price as a discount or premium to a published benchmark — typically Platts moly oxide or Fastmarkets moly oxide assessment. Avoid fixed-price for 12-month or longer contracts; the price volatility is too high. Use a published benchmark + premium/discount structure.
2. Origin clause. Specify whether the buyer requires non-Chinese material. The current pricing wedge between Chinese and non-Chinese moly oxide is meaningful. Buyers with US, EU, or defence-adjacent end markets typically specify non-Chinese origin.
3. Volume flexibility. Build in seasonal or monthly volume flexibility (±10% typical). Demand from steel-mill buyers and refinery catalyst buyers is not perfectly stable; the contract should accommodate.
Au Club’s offer
Au Club supplies molybdenum oxide (MoO₃, 63% Mo minimum) with 300 MT/month availability. Non-Chinese origin available for buyers with that requirement. FOB UAE, SGS inspection. LC and TT accepted.
The Au Club desk maintains active relationships with primary moly producers in Chile, Peru, Mexico, the US, and a number of by-product copper operators. We can structure spot, monthly offtake, and multi-year supply for buyers with appropriate requirements.
Au Club’s read for 2026
Three working positions:
Moly does not return to early-2024 prices in 2026. The structural drivers — stainless demand, China export friction, supply concentration — keep prices elevated. The base case range is $42,000-52,000/MT.
The Chinese-Western wedge persists. Non-Chinese moly continues to trade at a meaningful premium. Buyers with non-Chinese specifications should plan around this.
2027-2028 brings potential supply easing. New by-product moly from ramping copper projects (Kamoa-Kakula expansions, Oyu Tolgoi underground full ramp, Indonesian copper smelter build-out) adds supply. Whether that arrives in time for 2027 depends on copper project execution.
For procurement teams: lock 2026 supply at current pricing. Engage now for 2027-2028 forward arrangements. Do not wait for Chinese policy clarity that may not arrive.
FAQs
What is moly oxide?
Molybdenum trioxide (MoO₃) is the primary tradable form of molybdenum. Typical commercial grade is 63% Mo minimum (corresponding to approximately 95% MoO₃ purity). Sold in 250-kg drums or 1-MT super-sacks.
What is the current moly price?
US moly prices in early 2026 are trading in the $46,000-52,000/MT range. For real-time pricing, contact our trading desk or check Platts and Fastmarkets assessments.
Where does Au Club source molybdenum oxide?
Multiple producers, with the option of confirmed non-Chinese origin for buyers who require it. Primary sources in the Americas (Chile, Peru, US, Mexico) and selected by-product operations.
Will the moly price come back down?
Au Club’s base case for 2026 is sustained elevated pricing ($42,000-52,000/MT US). A meaningful decline requires either a US-China trade resolution or a stainless steel demand contraction — neither is signalled for 2026.
About Au Club
Au Club supplies molybdenum oxide (MoO₃, 63% Mo minimum) with 300 MT/month availability. FOB UAE, SGS inspection. LC and TT accepted. Contact our trading desk to discuss 2026 and 2027 supply.
Commodity payments are not interchangeable. A confirmed irrevocable LC sits at one end of the spectrum; a 30% TT against pro-forma invoice at the other. The right instrument depends on commodity value, lead time, country risk, counterparty history, and bank relationships. This piece is a working trader’s plain-English reference, written for procurement teams who buy across multiple commodity categories and need to understand the trade-finance landscape without becoming bankers.
Market Snapshot
5
Core trade-finance instruments
DLC
Most common LC type for new buyers
30%
Typical TT deposit on pro-forma
0–180d
Standard LC usance range
The five instruments at a glance
Five payment structures dominate commercial commodity trading:
Instrument
What it is
When you use it
Documentary LC (DLC / LC)
Bank pays seller when seller presents specified documents
High-value cargo, unfamiliar counterparty, international trade
Standby LC (SBLC)
Bank guarantees performance; pays only if buyer defaults
Long-term supply contracts, performance backing
Telegraphic Transfer (TT)
Direct wire from buyer to seller
Established counterparty, lower-value transactions
Documentary collection (D/P, D/A)
Bank facilitates document exchange against payment or acceptance
Less common in commodities but used in certain regions
Escrow
Third party holds funds until release conditions met
New counterparty, contested transactions
For commodity trade, LC and TT dominate. SBLC is used for long-term supply arrangements. The other instruments appear in specific scenarios.
Documentary Letter of Credit: how it actually works
The LC is the workhorse of international commodity trade. Mechanically, an LC is a bank’s promise to pay a seller a specified amount when the seller presents specified documents. The buyer (applicant) opens the LC at their bank (issuing bank). The issuing bank sends the LC to the seller’s bank (advising bank, often acting as the confirming bank). The seller ships, prepares documents, and presents to their bank. If documents comply with LC terms, the bank pays.
Three key features:
Irrevocable. Once issued, the LC cannot be amended or cancelled without all parties’ consent. This is what gives the seller assurance.
Documentary. The LC pays against documents, not against actual goods. Banks deal with paper. The documents typically required: commercial invoice, packing list, bill of lading, certificate of origin, certificate of analysis, inspection certificate. Some LCs require additional documents (Phytosanitary, fumigation, halal, etc.).
UCP 600 governance. International Chamber of Commerce’s Uniform Customs and Practice for Documentary Credits, 2007 revision. Defines how LCs operate worldwide. Most commercial LCs are issued subject to UCP 600.
Confirmed vs unconfirmed
An unconfirmed LC is paid by the issuing bank only. The seller bears the issuing bank’s credit risk and the country risk of the issuing bank’s jurisdiction.
A confirmed LC adds a second bank’s guarantee. The confirming bank (usually in the seller’s country or a major financial centre) commits to pay if the issuing bank does not. This is what sellers in emerging-market trade ask for when the issuing bank is in a higher-risk jurisdiction.
Confirmation cost is typically 0.5-2% per annum of the LC value, depending on the issuing bank’s jurisdiction and rating.
Sight vs deferred
A sight LC pays the seller on presentation of compliant documents. The buyer pays immediately. Cash flow: tight.
A deferred LC (also called usance LC) pays the seller a specified period after document presentation — typically 30, 60, 90, or 180 days. Common in commodity trade because it gives the buyer working capital flexibility. The discount cost (the buyer effectively borrowing from the bank) is built into the price.
A typical commodity transaction structure: 90-day deferred LC at sight, with the seller able to discount the LC at their bank for immediate funds. The discount cost (LIBOR/SOFR + margin) is paid by the seller.
SBLC: performance, not payment
A Standby Letter of Credit is structurally similar to an LC but functions as a guarantee, not a primary payment instrument. The SBLC sits behind a contract. The seller draws on the SBLC only if the buyer defaults on payment under that contract.
Typical use cases:
Long-term supply contracts. A 12-month or 24-month offtake contract. The seller wants assurance the buyer will pay. The SBLC, issued for, say, 110% of one month’s expected purchase value, sits behind the contract.
Performance backing for the seller. Some contracts require the seller to post an SBLC to guarantee delivery. Less common but used.
SBLC opening cost: typically 0.5-1.5% per annum of the SBLC value. Funded SBLCs (where the issuing bank requires cash collateral) are cheaper; unfunded SBLCs (issued against the applicant’s credit facility) are more expensive.
TT: when wire transfer is the right answer
Telegraphic Transfer (TT) is direct bank-to-bank wire. No conditions, no documentary trigger — the buyer simply instructs their bank to send money to the seller. SWIFT MT103 is the typical message format.
TT works when:
The counterparty is established and trusted. Years of dealing, established trust, no defaults.
The transaction value is moderate. TT is fine for $50,000-500,000. For multi-million-dollar cargoes, most buyers prefer LC structure.
Speed matters. A TT lands in the seller’s account within hours. An LC opens in days.
Typical TT structure in commodity trading:
30% TT against pro-forma invoice (PI). Down payment before shipment.
70% TT against documents. Balance against bills of lading and inspection certificates.
This structure is common in marine fuel bunker contracts (which are typically lower-value and counterparty-known), in fly ash trade (where ongoing relationships are established), and in small-volume metal concentrate trade.
The risk for the seller in a TT structure is that the buyer may not pay the balance after taking the documents. Sophisticated sellers retain title until full payment is received.
Documentary collection: D/P and D/A
Documentary collection is a less-used but useful instrument:
D/P (Documents against Payment). Buyer’s bank releases documents to the buyer only after the buyer pays.
D/A (Documents against Acceptance). Buyer’s bank releases documents to the buyer after the buyer accepts a bill of exchange — promising to pay at a specified later date.
Documentary collection is cheaper than LC (no bank guarantee, just a document-handling service) but riskier for the seller. If the buyer refuses to pay or accept, the seller has goods on the wharf at the destination port with no buyer.
Use cases are situational: established counterparties in jurisdictions where LC issuance is expensive or slow; low-value cargoes where LC fees would be disproportionate.
Escrow: when neither party trusts the other
Escrow is uncommon in commodity trade but appears in specific scenarios:
New counterparty with no track record
Distressed asset purchase
Contested transaction (e.g., quality dispute under arbitration)
A third party (typically a law firm or specialised escrow service) holds funds. Funds release on specified conditions. Most commodity transactions can be structured without escrow using LC, but for specific high-uncertainty deals it is the right tool.
Bank fees: what to budget
Approximate fee ranges (vary by bank, jurisdiction, transaction size):
Service
Typical fee
LC issuance
0.1-0.5% per quarter of LC value
LC confirmation
0.5-2% per annum of LC value
LC discrepancy fee
$75-200 per discrepancy
LC amendment
$100-300 per amendment
SBLC issuance
0.5-1.5% per annum
TT (outgoing)
$20-100 per transfer
Discounting (deferred LC)
LIBOR/SOFR + 0.5-2% per annum
The discrepancy fee deserves attention. Banks examine LC documents strictly. A typo, a date inconsistency, a misspelling — any discrepancy triggers a fee and may delay payment. Sophisticated commodity traders maintain LC documentation checklists to minimise discrepancies.
Test certificate (specific to commodity, e.g., assay certificate for metals)
Beneficiary statement (specific declarations like “non-Russian origin”)
The document set must match the LC exactly. A buyer who specifies “SGS inspection certificate” in the LC and accepts an Intertek certificate has accepted a discrepancy.
Commodity-by-commodity guidance
Au Club’s working approach to payment structure by commodity:
Marine fuel (VLSFO, HSFO). Typically TT — 30/70 or 50/50 against pre-shipment documents and bunker delivery note. Established counterparty preferred. LC used for first-time customers or for large cargoes.
Fly ash. TT or LC. Multi-year contracts often use LC structure to formalise the relationship. Spot smaller deliveries often use TT.
How to open an LC: a working sequence
For a buyer opening an LC against a confirmed Au Club purchase:
Confirm the contract terms with Au Club. Volume, specification, delivery terms (FOB/CFR/CIF), payment terms.
Approach your bank’s trade-finance desk. Provide the contract or PI.
Complete the LC application form. Your bank will draft the LC for review.
Review LC terms with Au Club. Au Club confirms the document requirements and any specific clauses.
Your bank issues the LC. Sent via SWIFT to Au Club’s bank.
Au Club’s bank confirms receipt. Au Club receives the LC text.
Au Club ships and prepares documents. Documents presented to bank.
Bank pays Au Club (sight LC) or accepts and pays at maturity (deferred LC).
The cycle from application to LC issuance typically takes 3-10 business days depending on the bank.
Au Club’s preferred payment structures
Au Club accepts LC and TT. Our preferred structures by typical commodity:
Commodity
Preferred structure
Marine fuel
TT 30/70 or established credit terms
Antimony, tungsten, moly
Confirmed irrevocable LC, 60-90 day deferred
Copper cathode
Confirmed irrevocable LC, sight or 90-day
Tin concentrate
LC, 60-90 day deferred
Fly ash
TT or LC depending on volume
For first-time buyers, we typically require confirmed LC from a top-tier bank. After successful transactions and established relationship, TT structures are available for smaller-value or established categories.
FAQs
What is the difference between LC and SBLC?
LC is the primary payment instrument — the bank pays when documents are presented. SBLC is a guarantee — the bank pays only if the buyer defaults under the underlying contract.
Is a TT safe for commodity payments?
Safer for established counterparties and smaller transactions. For new counterparties or high-value transactions, LC is the more protective structure for both parties.
How long does it take to open an LC?
Typically 3-10 business days from application to issuance, depending on the bank and the complexity of the LC text.
Why do some LCs cost more than others?
LC pricing reflects the issuing bank’s risk on the buyer (creditworthiness), the country risk of the buyer’s jurisdiction, and the confirmation cost if the LC is confirmed. Emerging-market buyer LCs cost more than OECD-buyer LCs.
About Au Club
Au Club accepts LC and TT for commodity transactions. Confirmed irrevocable LCs from top-tier banks are our standard payment instrument for high-value metals and minerals. Established TT relationships are available for marine fuel and certain mineral categories. Contact our trading desk to discuss appropriate payment structure for your purchase.
Indonesia’s refined tin exports collapsed to approximately 46,000 metric tons in 2024 — the lowest in more than twenty years. The country accounts for roughly 25-30% of world refined tin supply and the government has confirmed plans to halt exports entirely. For tin concentrate buyers — refineries, downstream solder manufacturers, electronics suppliers, tinplate producers — the procurement question for 2026 is no longer “Indonesia or somewhere else?” It is “where else, and how do I qualify the supply?” Thailand is the answer Au Club gives most customers. This is why, with the working details on specification, logistics, and contract structure.
Market Snapshot
46,000 MT
Indonesian refined tin exports (2024)
25–30%
Indonesia world supply share
20+ yrs
Lowest export level since
40–70% Sn
Au Club Thai concentrate grade
Why Indonesia is no longer the default
Three structural problems hit Indonesian tin supply in 2024-2025:
1. Smelter confiscations. In 2024, the Attorney General’s Office confiscated five private tin smelters representing approximately half of Indonesia’s refining capacity. The investigations involved allegations of illegal mining and corruption. The seized facilities operated at reduced or zero output during 2024.
2. RKAB (work plan) delays. Indonesia requires mining companies to submit and obtain approval for annual production plans (RKAB). Through 2024-2025, RKAB approvals from the Resources Ministry and Trade Ministry were delayed, suspended, or scaled back. Even smelters that were not confiscated faced production caps.
3. Government export-ban intent. Minister of Energy and Mineral Resources Bahlil Lahadalia confirmed in February 2026 that the government intends to halt tin exports, replicating the 2020 nickel export ban model. Implementation timing is uncertain but the policy direction is clear.
The cumulative effect: 2024 refined exports of 46,000 MT was approximately half the 2020 baseline. 2025 trends are similar. 2026-2027 are uncertain.
What this does to global tin supply
World tin mine production in 2023 was approximately 290,000-310,000 MT (estimates vary by source). Indonesia historically supplied 80,000-90,000 MT. China is the largest producer at approximately 80,000-100,000 MT. Then Myanmar (volatile, approximately 30,000-50,000 MT), Peru, Bolivia, Australia, DRC, Nigeria, and Thailand round out the supply base.
When Indonesia withdraws even 30,000-40,000 MT, the market scrambles. LME tin prices reflected this through 2024 and 2025: ranging from $25,000 to $35,000 per metric ton, well above the pre-2020 averages of $18,000-22,000.
For concentrate buyers (refineries), the question is not just price but availability. The Indonesian disruption pushed refineries to qualify new origin relationships.
Thailand’s tin profile
Thailand has been a tin producer since the 19th century. Modern Thai production is smaller than peak years (which exceeded 100,000 MT in the 1970s) but remains commercially meaningful. Current annual mine output is in the range of 8,000-15,000 MT, with the variability driven by artisanal and small-mine activity rather than primary industrial operations.
The Thai tin chain has three distinct stages:
Mining. Predominantly small-scale and artisanal, with significant operations in Phuket, Phangnga, and Ranong provinces. Some industrial operations exist but the majority is independent producer-aggregator activity.
Concentrate consolidation. Aggregators consolidate concentrate from multiple small producers, blend to target Sn content, and present to smelters or to international export buyers.
Export. FOB Laem Chabang for container shipment; FOB Bangkok for break-bulk.
Thailand’s advantage for international buyers is structural reliability rather than scale. The legal environment is stable. The aggregator infrastructure is established. The export route through Laem Chabang is direct and efficient. The currency (Thai Baht) is convertible. The Thai government is not pursuing export restrictions.
Specification: 40-70% Sn concentrate
Tin concentrate sold internationally is graded by tin content:
Grade
Sn content
Typical buyer
Key impurities to monitor
Low-grade
40-50% Sn
Smelters with flexible feed
As (arsenic), Fe (iron), Pb (lead)
Mid-grade
50-60% Sn
Standard refinery feed
As, Fe, Pb, S (sulphur)
High-grade
60-70% Sn
Premium refineries
As, Fe, Pb, low S preferred
A typical Thai concentrate Au Club moves into international markets sits in the 55-65% Sn range. Higher Sn content commands a higher price per dry metric ton, but the relationship is not linear — penalty schedules for impurities (especially arsenic, which raises smelting costs and environmental compliance burden) can affect the net realised price.
The Thai concentrate Au Club handles typically meets:
Sn: 55-65% (specified per shipment)
As: ≤ 0.5% (lower preferred)
Fe: ≤ 5%
Pb: ≤ 1%
S: ≤ 2%
Moisture: ≤ 5% at loading
Pre-shipment inspection is by SGS or Alex Stewart. Each shipment carries a Certificate of Analysis with chemistry, moisture, and weight.
Logistics: FOB Laem Chabang
The working logistics:
Loading port. Laem Chabang, approximately 2 hours by road south of Bangkok. Major container terminal with established mineral concentrate handling. Some shipments load at Bangkok or other Thai ports for break-bulk, but container shipment from Laem Chabang is the standard for international buyers.
Vessel sizing. Tin concentrate is high-value and low-volume per unit. Most shipments move in containers (20-foot, 25-30 MT per container) rather than break-bulk vessels. Lot sizes typically 50-300 MT.
Lead times. From order confirmation to FOB Laem Chabang typically 30-45 days, depending on aggregation cycle. Ocean transit to Gulf ports approximately 18-25 days. To European ports 30-35 days. To Asian destinations (China, Japan, Korea) 7-14 days.
LME tin price reference. Most concentrate contracts price as a discount to LME tin three-month, with the discount reflecting Sn content, impurity penalties, and smelter treatment charges. A typical 60% Sn concentrate might price at LME three-month tin minus 20-25% (representing the contained tin payable, treatment charges, and impurity penalties).
Malaysia and Myanmar as secondary origins
Two other origins Au Club tracks:
Malaysia. Historical tin producer with a small but consistent modern output. Pricing and reliability comparable to Thailand. FOB Port Klang. Volumes smaller than Thai aggregators.
Myanmar. A meaningful tin producer, but with three constraints. First, much Myanmar tin output is informal and concentrated in the Wa State region under unclear governance. Second, supply has been volatile, with significant interruptions in 2023 from operational disruptions. Third, US sanctions on Myanmar military entities complicate buyer compliance. Some buyers source Myanmar tin successfully; many compliance regimes flag it.
For buyers prioritising clean documentation and predictable supply, Thailand is the more accessible origin.
How an Au Club tin concentrate contract is structured
Standard terms for a refinery buyer:
Volume. Per enquiry, typically 50-500 MT per shipment, with annual offtake commitments possible.
Sn content. 40-70% (specified per shipment).
Origin. Thailand (primary), Malaysia (secondary).
Loading port. Laem Chabang (Thailand) or Port Klang (Malaysia).
Price formula. LME three-month tin minus negotiated treatment charge and impurity penalties. Fixed price available for shorter contracts.
Payment. LC at sight, deferred LC (30/60/90 days), or TT against documents. Most international refineries use LC.
For first-time buyers, Au Club typically offers a single-shipment trial (50-100 MT) to allow the refinery to qualify the concentrate against its smelting process. Successful trial shipments lead to monthly or quarterly offtake.
Au Club’s read for 2026
Three working positions:
Indonesian supply remains unreliable through 2026. Whether or not the formal export ban implements on schedule, Indonesian tin in the international market will be intermittent and unpredictable. Plan around it, not for it.
Thai supply has structural headroom. Existing aggregator infrastructure can absorb additional buyer demand without disruptive price moves. 2026 supply is available for refineries willing to engage on contract structure.
LME tin trades in $28,000-38,000/MT range through 2026. The Indonesian uncertainty puts a floor under price; new supply ramp from secondary origins keeps a ceiling on speculative spikes.
For refineries and downstream tin buyers: qualify a Thailand origin now. The cost of qualifying a new supply chain is meaningful — sample analysis, smelter trials, documentation discipline — but it is much smaller than the cost of being short of feed when Indonesian shipments don’t arrive.
FAQs
Is Indonesia really going to ban tin exports?
The government has confirmed the intention as recently as February 2026. Implementation timing is being negotiated. Industry representatives are pushing for phased introduction. The 2020 nickel-ban precedent suggests the government will follow through.
Where is the world’s tin produced?
China (~30%), Indonesia (~25-30% in normal years), Myanmar (~10-15%), Peru, Bolivia, Australia, DRC, Thailand, Nigeria, Malaysia, Vietnam, Russia. Production concentration is meaningful but less than tungsten or cobalt.
What is the current price of tin concentrate?
Tin concentrate prices reference the LME three-month tin price, discounted for treatment charges, impurity penalties, and contained tin payable. As of late 2025, LME tin three-month is in the $30,000/MT area. Concentrate at 60% Sn might price at approximately 75% of contained tin value.
Does Au Club handle Myanmar-origin tin?
Au Club’s primary tin origins are Thailand and Malaysia. We can discuss Myanmar concentrate for specific buyer requirements, with the compliance and provenance documentation that entails.
About Au Club
Au Club supplies tin concentrate (40-70% Sn) from Thailand and Malaysia, FOB Laem Chabang or Port Klang. SGS or Alex Stewart pre-shipment inspection. LC and TT accepted. Contact our trading desk for sample analysis, trial shipments, and 2026 offtake arrangements.
Resource nationalism stopped being a footnote in 2024. The DRC’s February 2025 cobalt export ban, Mali’s $1.2 billion mining-company arrears recovery, Indonesia’s confirmed plan to halt tin exports, and Burkina Faso’s nationalisation push are not isolated stories. They are a co-ordinated shift in how producer states extract value from their mineral wealth. For commodity buyers, the implication is straightforward: country risk is no longer something to hedge against — it is a structural input to procurement strategy. This article scores ten producing jurisdictions on six risk dimensions and proposes contract clauses that hold up when policy shifts overnight.
Market Snapshot
Feb 2025
DRC cobalt export ban
$1.2B
Mali mining-company arrears claim
10
Jurisdictions risk-scored
6
Risk dimensions evaluated
The six country-risk dimensions that matter
A buyer evaluating country risk on a critical minerals purchase should assess six independent dimensions:
Legal stability. Predictability of mining law, contract enforcement, and dispute resolution.
Tax regime. Royalty rates, profit tax, windfall tax exposure, and the predictability of changes.
Expropriation risk. Outright nationalisation or forced share transfer to state-owned entities.
Currency convertibility. Ability to repatriate proceeds in USD or EUR at market rates.
Logistics reliability. Port capacity, road and rail integrity, customs efficiency.
Social licence. Community relations, indigenous land claims, labour stability.
Each dimension can be rated independently. Aggregate “country risk” is the combination — but no two buyers weight the dimensions identically. A defence supply chain weighs expropriation differently than a commercial trader weighs convertibility.
Heat-map: ten jurisdictions, six dimensions
Country
Legal
Tax
Expropriation
Currency
Logistics
Social licence
Aggregate
DRC
Red
Amber
Amber
Red
Red
Amber
High
Mali
Red
Red
Amber
Amber
Red
Amber
High
Burkina Faso
Red
Amber
Red
Amber
Red
Red
High
Indonesia
Amber
Amber
Amber
Amber
Amber
Amber
Medium-High
Peru
Amber
Amber
Green
Green
Amber
Amber
Medium
Chile
Green
Amber
Green
Green
Green
Amber
Low-Medium
South Africa
Amber
Amber
Green
Amber
Red
Red
Medium-High
Russia
Red
Red
Red
Red
Amber
Amber
High (sanctioned)
Myanmar
Red
Red
Amber
Red
Red
Red
Very High
Tajikistan
Amber
Amber
Amber
Amber
Amber
Amber
Medium
The dominant pattern: the lowest-risk jurisdictions (Chile, Peru) are price-takers in tightly priced markets. The highest-risk jurisdictions (DRC, Mali, Burkina, Russia, Myanmar) host significant tonnage of strategic minerals. There is no clean way to source critical minerals at scale from only low-risk jurisdictions in 2026.
Three country deep-dives
DRC: the February 2025 cobalt ban and October 2025 quota regime
The DRC produces approximately 70% of world cobalt, mostly as a copper by-product. In February 2025, the government imposed an outright export ban on cobalt concentrate. The stated rationale: build domestic refining capacity, capture more value, curb informal smuggling.
The ban created an immediate cobalt price spike (cobalt sulphate prices nearly doubled in Q1-Q2 2025) and severe disruption to refiners in China and Europe. In October 2025, the government lifted the ban but replaced it with a quota system: 18,125 MT for the remainder of 2025, then 96,600 MT/year for 2026 and 2027 — less than half of the DRC’s 2024 export volume.
The DRC also opened a copper export revenue audit, alleging revenue leakage in the export chain. Copper exports in Q1 2026 were down 15% year-on-year, reflecting some combination of quota effect, mine disruption, and audit-related delays.
The strategic takeaway for buyers: DRC supply is real but not reliable on a quarterly basis. Annual offtake agreements with major operators (Glencore, ERG, CMOC) are workable. Spot relationships are exposed to policy whiplash.
Mali: the $1.2 billion arrears recovery and the Barrick standoff
Mali’s military government has pursued an aggressive revenue strategy. The “Code Minier” revision raised royalty rates and applied retroactive assessments to existing mining operations. The government recovered approximately $1.2 billion in claimed arrears through audits and negotiations.
The Barrick Mining dispute is the highest-profile case. The Loulo-Gounkoto gold complex was disrupted by the dispute. Mali’s gold mine supply fell 19% in 2025 to approximately 81.2 metric tons. The disruption is meaningful for global gold supply at the margin.
Beyond gold, Mali hosts significant lithium and rare earth potential. The Goulamina lithium project is partially developed. The political environment makes new project financing difficult.
For commodity buyers: Mali is suitable for spot or short-tenor purchasing relationships, but locking multi-year supply is high-risk in the current political configuration.
Indonesia: the tin export-ban runway
Indonesia is the second-largest tin producer globally and accounts for approximately 25-30% of global refined supply. In 2024, refined tin exports collapsed to 46,000 MT — the lowest in two decades — driven by smelter seizures, RKAB (work plan) approval delays, and licence rationalisation.
In February 2026, Minister of Energy and Mineral Resources Bahlil Lahadalia confirmed government plans to halt tin exports entirely. The stated rationale mirrors the 2020 nickel export ban: force domestic value-addition before export. The 2020 nickel ban produced multi-billion-dollar investments in Indonesian smelter capacity and a ten-fold increase in nickel-product export value — the government cites this as the template.
Tin industry representatives have asked for phased implementation rather than immediate ban. Industry concerns include job losses (Bangka Belitung produces 91% of Indonesia’s tin and tin is 81.7% of provincial export value) and a sharp price spike that hurts domestic downstream consumers.
For tin buyers: Indonesian supply is not reliably available on a multi-year forward basis. Thailand (Au Club’s working origin) and Malaysia are the realistic alternatives. See Au Club’s October 2025 article on Thailand tin sourcing for working details.
The 2024-2026 resource nationalism timeline
A compact view of the major actions:
Date
Country
Action
Aug 2024
China
Antimony export licence regime
Feb 2025
China
Tungsten, moly, bismuth, indium, tellurium added to controls
Feb 2025
DRC
Cobalt export ban (10 months)
Q1 2025
Mali
Revenue arrears settlement; Barrick dispute
Mar 2025
Burkina Faso
Mining law revisions; state-stake increases
Jul 2025
US
Section 232 copper at 50%
Sep 2025
Indonesia
RKAB approval rationalisation
Oct 2025
DRC
Quota regime replaces ban (18,125 MT 2025; 96,600 MT/yr 2026-27)
Feb 2026
Indonesia
Confirmed plan to halt tin exports
Q1 2026
DRC
Copper export revenue audit
Apr 2026
US
Section 232 derivatives overhaul
Not every action above is “resource nationalism” in the strictest sense — Section 232 is industrial policy by the importing country. But the cumulative effect on buyers is the same: governmental action is now a primary driver of commodity supply and price.
Contract clauses that hold up under policy whiplash
Three clauses worth getting right in any 2026 contract for high-risk-jurisdiction supply:
1. Force majeure scope. Generic FM language (“acts of government”) is insufficient. Specific events to include: – Export licence withdrawal or non-renewal at the origin country – Government-imposed quota changes – Mine closure order or operating-licence withdrawal – Sudden tariff or duty imposition by the destination country – Banking sanctions affecting payment or document presentation
2. Country-of-origin warranty. The seller warrants origin and provides documentation. The buyer has the right to inspect smelter records (with reasonable notice) and to reject shipments with non-conforming origin.
3. Pricing flexibility. Long-dated fixed-price contracts in high-risk-jurisdiction supply are dangerous. Floating reference (against an LME or Fastmarkets benchmark) is the safer structure. Multi-year contracts should permit annual re-pricing if origin-country royalty or tax changes shift the seller’s cost base.
Premia in 2025 range broadly: 0.3-1.2% of insured value per year for emerging-market trade financing, higher for jurisdiction-specific high-risk exposures. The cover pays out only when specific defined events occur; routine disruption (quota changes, licence delays) is typically excluded.
For large multi-year contracts, the premium can be material but justifiable. For routine spot purchases, the cost-benefit usually doesn’t work.
Au Club’s risk-management approach
Au Club operates in multiple high-risk jurisdictions (we source tin from Thailand, antimony from non-Chinese origins, fly ash from Kazakhstan, etc.). Three principles inform our approach:
Diversified origin within each commodity. No single-origin exposure for any product line. Antimony from two non-Chinese origins; fly ash from four; tin from Thailand and Malaysia.
Documentary discipline. Origin documentation is integrated into every shipment — not retro-fitted when a buyer asks.
Transparency with buyers about risk. When a particular origin becomes harder to source from due to policy changes (Indonesian tin in 2025-2026, DRC cobalt in 2025), we tell customers explicitly rather than absorbing the risk silently.
For procurement teams: country risk is now a working input, not a tail risk. Score your suppliers, score your origins, build the resilience now.
FAQs
Which producing country has the highest current risk for commodity buyers?
By aggregate scoring, Myanmar, Russia (sanctioned), and Burkina Faso represent the highest current risk. DRC, Mali, and Indonesia are high-risk but more accessible in working contracts.
Did the DRC cobalt ban actually end?
The outright ban ended in October 2025. It was replaced with quotas: 18,125 MT for the rest of 2025, then 96,600 MT/year for 2026 and 2027 — substantially below 2024 export volumes.
Will Indonesia really ban tin exports?
Government statements (most recently February 2026) confirm the intention. Implementation timing is being negotiated. Industry representatives want phased introduction. The 2020 nickel-ban precedent suggests the government will follow through, though the exact date is uncertain.
Is political-risk insurance worth the cost?
For large multi-year contracts in high-risk jurisdictions, often yes. For routine spot purchases, the cost-benefit usually doesn’t justify the premium. Quote-shop multiple specialty insurers.
About Au Club
Au Club is a Dubai-based commodity trader. We source from multiple origins per commodity to manage country-risk concentration. Each shipment includes origin documentation and inspection certificates. Contact our trading desk for current sourcing options across your commodity requirements.
On 12 April 2024, the US Treasury and the UK Government announced parallel restrictions on Russian-origin aluminium, copper, and nickel produced from 13 April onwards. Sixteen months later, the immediate market reactions — aluminium spiking 9.4% in a single day, the LME and CME re-papering warehouse stocks — have given way to a more interesting structural picture. Documentary origin now trades at a measurable premium. LME warehouse composition has shifted. And buyers writing 2026 contracts cannot treat origin as a tick-box exercise. Here is what changed, what stuck, and what buyers should be doing now.
Market Snapshot
12 Apr 2024
Ban effective date
+9.4%
Aluminium 1-day spike post-announcement
16 months
Time since announcement
Premium
On documented non-Russian origin
What was banned and what was grandfathered
The 12 April 2024 announcement was carefully constructed. The restrictions did not ban Russian-origin metal outright. They banned:
Import to the US and UK of Russian-origin aluminium, copper, and nickel produced on or after 13 April 2024.
New LME and CME warrants from Russian metal produced on or after 13 April 2024.
Critically, Russian-origin metal produced before 13 April 2024 remained eligible for LME warranting. That created a two-tier market: pre-ban Russian metal could continue to trade on the LME, while post-ban Russian metal could not.
The LME’s own rules went further. In April 2024, the LME introduced restrictions on the ability of Russian-origin metal to be delivered against new LME contracts, while maintaining warrant validity for pre-existing stocks. Subsequent rule refinements addressed potential “gaming” — moving Russian-origin metal between warehouses to extend its tradeability.
The result was a complex and evolving rulebook that traders, brokers, and warehouse operators have been navigating for sixteen months.
Pre-ban warehouse composition
The immediate stock backdrop was striking. Before the 12 April announcement, Russian metal dominated LME warrant stocks:
Metal
Pre-ban LME warehouse share (March 2024)
Aluminium
~91% Russian-origin
Copper
~62% Russian-origin
Nickel
Significant share (composition less concentrated)
These shares reflected years of accumulation. Russian primary aluminium producer Rusal had been the dominant warrant supplier to LME warehouses for over a decade. Russian copper from UMMC and the Russian Copper Company similarly built up.
When the ban took effect, this pre-ban stock did not disappear. It remained in LME warehouses, eligible for re-warranting under the rules, and continued to trade. The new prohibition applied only to post-13-April production.
The immediate market reaction
The 12-19 April 2024 price reaction was dramatic but short-lived:
Metal
Day-after move
One-week move
One-month move
Aluminium
+9.4% (highest single-day move since 1987)
+4%
-1%
Copper
+2.5%
+1%
+0.5%
Nickel
+8.8%
+5%
-3%
The initial spike priced in worst-case supply scenarios. As traders worked out the grandfather clause and the pre-ban warrant pool, prices normalised. By mid-May 2024, headline LME prices had largely retraced.
But underneath the headline, three more durable effects took hold.
The three durable effects
1. Russian-origin metal moved off-warrant
Most Russian-origin post-13-April production has gone to non-LME-warrant destinations — primarily China, Turkey, the UAE, and selected MENA re-export markets. China imports of Russian aluminium and copper rose substantially through 2024 and 2025.
This means the headline ban achieved part of its objective: Russian revenue from Western markets dropped meaningfully. But globally, Russian metal continues to flow at near-pre-ban volumes — just to different buyers.
2. A documentary-origin premium emerged and persists
Non-Russian Grade A copper, P1020 aluminium, and Class 1 nickel now trade at a measurable premium to Russian-origin equivalent. The premium varies by metal:
Metal
Non-Russian premium (approx, mid-2025)
Aluminium P1020
$40-90/MT over Russian-equivalent off-warrant prices
Copper Grade A
$25-60/MT
Nickel Class 1
$200-450/MT
For aluminium, the premium widened sharply in April 2024 and narrowed somewhat through 2024-2025 as the market adjusted. For copper, the premium has been more stable. For nickel, the premium reflects the metal’s smaller market and concentration of non-Russian supply (Indonesia, Australia, New Caledonia).
3. LME warehouse composition shifted
By August 2025, LME warehouse composition had changed materially from the pre-ban baseline:
Metal
LME warehouse Russian share (March 2024)
LME warehouse Russian share (Aug 2025)
Aluminium
~91%
~78%
Copper
~62%
~38%
The shift reflects pre-ban Russian metal being drawn down through trading, with new warrants coming predominantly from non-Russian sources. The pre-ban Russian stocks will continue declining as physical buyers draw them down for delivery.
What documentary requirements actually look like in 2025
For a buyer wanting confirmed non-Russian origin, the working documentation set:
1. Certificate of Origin (COO). Issued by the chamber of commerce of the producing country. References the smelter and the country of production.
2. Mill Test Certificate (MTC) or Certificate of Analysis (COA). From the smelter, listing chemical composition and the heat / lot number. Cross-references to the LME registered brand if applicable.
3. LME Warrant (if buying on warrant). Specifies the warehouse, the brand, and the production date. The combination of brand and date establishes whether the metal is pre-ban or post-ban Russian (subject to LME rule eligibility).
4. Smelter declaration. Some sophisticated buyers ask for a direct smelter declaration confirming country of melt and country of pour. This is becoming standard for defence-adjacent applications.
5. Sanctions screening. The buyer’s bank and the LC-confirming bank screen the smelter, the country, and the registered brand against OFAC SDN list, UK HMT consolidated list, and EU Council Regulation lists.
For a contract drafted in 2023, much of this was implicit. For a contract drafted in 2025, it should be explicit.
How to draft an origin clause that holds up
Three elements that should appear in any 2026 contract:
Specific exclusion language. Not “non-sanctioned origin” (vague) but “Russian-origin metal, including metal produced at any smelter located in the Russian Federation or by any entity owned 50% or more by a Russian person or entity, is excluded.” Reference applicable OFAC/HMT/EU regulations by name.
Documentation chain of custody. Specify required documents at each transfer point (loading port, in-transit, discharge port). Specify that failure to produce these documents triggers buyer’s right to reject without penalty.
Audit right. Buyer’s right to inspect, with reasonable notice, the supplier’s smelter relationships and origin documentation. This is the clause sophisticated buyers add and most suppliers accept.
Au Club’s documentation approach
Au Club’s standard cathode shipment includes:
COA from the smelter
Certificate of Origin from the host chamber of commerce
LME warrant where applicable
Bill of Lading and Packing List
Statement of non-Russian origin (separate document, signed by Au Club)
Inspection report by SGS or Intertek
The Au Club statement of non-Russian origin is a standing document for our Turkey and UAE sourcing. It is reissued per shipment, dated, and includes the smelter name and production reference. This is the document our buyers’ compliance teams cite when their banks ask for confirmation.
Au Club’s read for 2026
Three working positions:
The ban does not get rolled back in 2026. A Russia-Ukraine settlement might trigger phased relief, but no major Western jurisdiction has signalled relaxation of the metals restrictions.
The origin premium persists at current levels or modestly widens. Documentary scrutiny is increasing, not decreasing. Premium for confirmed origin reflects real compliance cost — not pure scarcity.
Pre-ban Russian warrant stock will deplete by mid-2027. The pool of pre-13-April-2024 Russian metal in LME warehouses is finite. As it depletes, the LME composition will shift further to non-Russian sources. By 2027, the Russian share of LME aluminium warrants will likely fall below 50%.
For buyers writing 2026 supply contracts: get the origin documentation explicit, build buffer for documentation-related delays at customs, and budget the non-Russian premium into your annual procurement.
FAQs
Can I still buy Russian-origin copper on the LME?
Russian-origin metal produced before 13 April 2024 remains eligible for LME warrants and can trade. Post-13-April production cannot be newly warranted on the LME or CME. The pre-ban stocks are gradually depleting.
What is the premium for non-Russian Grade A copper?
Approximately $25-60/MT over Russian-equivalent off-warrant pricing in mid-2025. The premium is most pronounced for buyers with strict sanctions screening requirements (defence, US/UK government suppliers).
Does Au Club handle Russian-origin material?
No. Au Club’s Turkey and UAE cathode sources are non-Russian. We provide a statement of non-Russian origin with each shipment.
Will the LME ban be lifted?
Not in any near-term scenario. A future political settlement on Russia-Ukraine could trigger phased relief, but no major Western jurisdiction has signalled that.
About Au Club
Au Club supplies non-Russian-origin LME Grade A copper cathode (99.99% Cu min) from Turkey and the UAE. Each shipment includes full origin documentation, smelter-of-origin attestation, and SGS or Intertek pre-shipment inspection. Contact our trading desk to discuss compliant supply for your 2026 requirement.
On 30 July 2025 the White House added copper to the Section 232 tariff list at 50%, matching the rates on steel and aluminium. For Gulf-based copper cathode suppliers, the immediate effect was a sharp drop in US-bound demand and a parallel widening of arbitrage opportunities into Asia and Europe. For US-based industrial buyers, the effect is a 50% landed-cost increase on imported cathode that, in 2024, supplied roughly half of US copper consumption. This article maps the regulatory chronology, the trade-flow consequences, and the contractual adjustments Au Club’s customers are making for 2026.
Market Snapshot
50%
US tariff on imported copper
30 Jul 2025
Effective date
~50%
US imports as share of consumption (2024)
+50%
Landed cost increase for US buyers
How we got here: the 2025 chronology
The Trump administration’s second-term Section 232 programme has moved fast:
February 2025: Steel and aluminium Section 232 tariffs reimposed at 25%. Most country-specific exemptions and product-specific exceptions eliminated.
June 2025: Steel and aluminium rates doubled to 50%.
30 July 2025: Copper added to Section 232 at 50%.
Section 232 of the Trade Expansion Act of 1962 allows the US president to impose tariffs based on national security concerns. The Department of Commerce conducts the underlying investigation. The Trump administration argues — and the Commerce reports support — that domestic steel, aluminium, and copper production capacity is insufficient for national defence requirements.
The first-term tariffs (2018-2020) hit steel at 25% and aluminium at 10%. The second-term escalation has been faster, broader, and at higher rates. The 50% rate on three primary metals is a meaningful departure from any prior US trade policy.
What the copper tariff actually covers
The Section 232 copper measure covers:
In scope (50% tariff): – Refined copper cathode (UNS C11000 and equivalent grades) – Copper anodes – Copper concentrate (if imported) – Copper alloys (including brass and bronze) – Copper wire rod – Copper bar and rod – Copper sheets and strip – Selected copper derivatives (motors, transformers, wire products)
Out of scope or under exception: – Copper scrap (case-by-case) – Specialty copper alloys used in semiconductor manufacturing (subject to review) – Some sub-categories of finished consumer electronics
The April 2026 overhaul significantly broadened the derivative product coverage — the original July 2025 measure focused on primary forms, while subsequent expansion drew in downstream products including household articles, certain automotive components, and selected industrial machinery containing copper. For 2025 trade flows, the immediate effect is on primary cathode imports.
What this does to US-bound copper trade flow
In 2024 the US consumed approximately 1.8 million MT of refined copper. Domestic production met roughly 50% of demand. The remainder was imported, primarily from:
Country
Approx 2024 imports (MT)
Share
Chile
540,000
30%
Mexico
270,000
15%
Peru
90,000
5%
Canada
90,000
5%
Other (Australia, UAE, Kazakhstan, etc.)
90,000
5%
The 50% tariff applies to all of these origins. Chile retains a small advantage from the US-Chile Free Trade Agreement, but the Section 232 tariff supersedes most FTA preferences. The practical effect is a sharp landed-cost increase across all imported cathode.
US industrial buyers — electric motor manufacturers, cable producers, transformer assemblers — face three options:
Pay the tariff. Absorb or pass through to end customers. This works for buyers with pricing power.
Switch to scrap-based copper. Domestic copper scrap supplies a meaningful share of US recycled copper output. Scrap availability is limited by collection rates, but margins for scrap-based refiners have widened.
Relocate downstream manufacturing. Producing finished products outside the US, then importing the finished goods if those products are not in the derivative tariff scope. This works for some products but the April 2026 expansion narrows that path.
For Gulf cathode suppliers, the immediate effect is that US-bound shipments became uneconomic almost overnight. Au Club has not shipped material to US destinations since July 2025.
Arbitrage windows and where Gulf cathode is going instead
The displaced US demand creates space in Asian and European markets for cathode that would otherwise have moved west. Three trade flow shifts:
1. UAE/Turkey cathode → European premiums widening. With US-bound material now uneconomic, European buyers are competing harder for Gulf-sourced Grade A cathode. European cathode premium (the physical premium over LME) has widened by approximately $30-50/MT through Q3 2025.
2. Comex-LME arbitrage. The Comex copper price (US domestic market) trades at a premium to LME (international market) approximately equal to the tariff cost. Traders who can move cathode through US customs at preferential rates (Free Trade Zone, USMCA where applicable) capture some of this spread. The arbitrage window has been wide in late 2025.
3. Asian cathode demand absorption. Chinese, Indian, and Southeast Asian buyers have absorbed some of the displaced US-bound volume. India in particular has expanded copper imports through 2025 as the country’s electrification programme accelerates.
For Au Club’s customer base, the practical effect: 2026 supply commitments are weighting toward Europe, India, Japan, and intra-Gulf delivery. US-nexus has effectively been removed from the working sales territory.
Compliance and documentation — what changes for cathode buyers
For non-US buyers, the documentation burden has increased even when they are not importing to the US. Three issues:
Smelter of origin documentation. Section 232 implementation references the country of last substantial transformation (typically the smelter location). Buyers re-exporting copper to the US — even from a third country — need clean smelter-of-origin documentation. Au Club provides this on every shipment.
Melt-and-pour records. Some Section 232 implementations have referenced “country of melt and pour” for steel and increasingly for copper. The COA, LME warrant, and smelter records together should establish this. Buyers should confirm their documentation package supports this attestation.
HTS code classification. Section 232 applies to specific HTS codes (Harmonized Tariff Schedule). Mis-classification — even unintentional — can result in penalties. Sophisticated US importers now use legal review of cathode HTS classifications before declaration.
What Au Club is writing into 2026 contracts
Three contract elements that have changed since July 2025:
Destination flexibility. Standard sales contracts now include explicit destination-change provisions allowing the buyer to divert cargo between approved destinations without penalty if tariff conditions change.
Tariff cost allocation. New contracts explicitly assign tariff cost to the buyer (DAP/DDP delivery to the destination) unless otherwise specified. CIF or FOB contracts naturally place tariff risk with the buyer, but customers have asked for explicit clauses.
Force majeure. Trade-policy actions (new tariffs, sanctions, export licence withdrawal at origin) are now explicitly listed as FM events. The generic FM language drafted before 2018 did not contemplate tariff regime changes.
Au Club’s read for 2026
Three working positions:
The Section 232 copper tariff is permanent for the foreseeable future. It would take a meaningful US-China trade agreement or a change in administration to reverse. Neither is signalled for 2026.
Gulf cathode flows shift permanently toward Asia and Europe. The US market is structurally less accessible for non-FTA cathode. UAE and Turkey will deepen Asian and European relationships.
The Comex-LME spread will not fully close. Arbitrage compresses the spread but never eliminates it under a 50% tariff regime. Expect persistent premium for US-domestic copper.
For non-US cathode buyers, the picture is straightforwardly positive: more available supply, longer-tenor contracts on offer, and historically high — but stable — premium structures. For US buyers, the picture is challenging: paying for imported copper, competing for scrap, or relocating production.
FAQs
What is Section 232?
Section 232 of the Trade Expansion Act of 1962 allows the US president to impose tariffs on imports deemed a threat to national security. The Trump administration has used Section 232 for steel, aluminium, and (since 30 July 2025) copper at 50% rates.
Does Section 232 apply to copper scrap?
Currently scrap is largely out of scope or treated under exception, though this is subject to ongoing review.
How does Section 232 affect my non-US copper purchases?
If you are not importing to the US, the tariff does not directly apply. Indirectly, it has widened the spread between US (Comex) and international (LME) prices, and has shifted Gulf-origin cathode flows toward Asia and Europe.
Can the tariff be appealed or excluded?
The April 2026 overhaul eliminated most country-specific and product-specific exclusions that had accumulated. Some narrow exclusions remain available through Commerce Department review.
About Au Club
Au Club supplies LME Grade A copper cathode (99.99% Cu minimum) from Turkey and the UAE, primarily to European, Asian, and Gulf customers. Full smelter-of-origin documentation with each shipment. Multi-year supply structures available. Contact our trading desk to discuss your 2026 requirement.
The 2026 annual copper TC/RC benchmark is being negotiated at or near $0 per metric ton — an unprecedented level. Smelters are paying for the privilege of refining concentrate. The cause is straightforward: Chinese smelter capacity additions over the past five years have run ahead of global concentrate supply growth, and Chinese smelters now account for over 90% of growth in global copper output. For cathode buyers outside China, that has translated into record LME prices and tight prompt availability of LME-registered Grade A material. This article explains the mechanism, the numbers, and the procurement implications for 2026 cathode buyers.
Market Snapshot
~$0/MT
2026 copper TC/RC benchmark
90%+
China share of global smelter capacity growth
LME Grade A
Tight prompt availability
99.99% Cu
Min purity / BS EN 1978:1998
What TC/RC is and why $0 matters
Copper smelters do not produce copper from ore. They produce copper cathode from concentrate — typically 25-30% Cu material delivered from mines. The smelter’s revenue model has two parts:
By-product credits. Gold, silver, molybdenum, and sulphuric acid produced as by-products of copper refining.
Treatment and refining charges. A fee per ton of concentrate processed (TC, treatment charge) and per pound of payable copper refined (RC, refining charge). These are deducted from the mine’s gross revenue and paid to the smelter.
For thirty years TC/RCs have functioned as the global pricing mechanism for the concentrate market. When concentrate is scarce, smelters bid each other down to win tonnage — TC/RCs fall. When concentrate is abundant, TC/RCs rise.
The annual benchmark TC/RC is negotiated each year between Freeport-McMoRan (or another major Western miner) and a Chinese or Japanese smelter. The 2024 benchmark settled at $80/MT. The 2025 spot has run as low as the $20s. The 2026 benchmark is being negotiated at or near $0.
$0 is not a normal price level. It signals that smelters are willing to accept zero processing fee — or even pay miners — to keep their furnaces loaded. That has happened in moments of acute concentrate scarcity (China’s industrial growth phase in the early 2000s); $0 as a sustained benchmark is genuinely new.
What is causing this
Three structural forces are at work:
1. Chinese smelter capacity has run ahead of concentrate
Between 2015 and 2025, Chinese refined copper output approximately doubled. New smelters at Tongling, Jiangxi, Yangzhou, Yantai, and several other locations brought online substantial new capacity. China’s share of global smelter output rose from approximately 15% to nearly 50% over the decade.
Mine supply did not keep pace. Major new projects (Quellaveco in Peru, Kamoa-Kakula in DRC) added supply, but project delays at Las Bambas (Peru), Cobre Panamá (Panama, closed since November 2023), and Mongolia’s Oyu Tolgoi underground expansion limited the upside.
The structural shortfall: too much smelter, not enough concentrate. Smelter competition for concentrate drives TC/RCs down.
2. The Cobre Panamá closure removed material supply
First Quantum’s Cobre Panamá mine was producing approximately 350,000 MT/year of copper-in-concentrate when the Panamanian Supreme Court ordered closure in November 2023. The mine has not restarted. That removed roughly 1.5% of global mine supply at a moment when smelter capacity was still growing.
3. DRC quotas constrain growth
The DRC was the fastest-growing copper producer in the world through 2023. In early 2025 the government imposed export quotas (originally a ban, then a quota regime) that constrained the upside even when production was theoretically available. DRC Q1 2026 copper exports of approximately 955,000 MT were down 15% year-on-year from Q1 2025’s 1.09 million MT.
What this means for the LME copper price
The LME three-month copper price has reacted accordingly. Through late 2025, the price climbed toward $13,000/MT and reached a record $14,527.50/MT on 29 January 2026. The forward curve has shown sustained backwardation — physical buyers paying a premium for prompt metal.
Period
LME 3-month copper ($/MT)
Q1 2024
$8,400
Q3 2024
$9,200
Q1 2025
$9,500
Q3 2025
$11,200
Q4 2025
$12,800
Late Jan 2026 (record)
$14,527.50
The price reflects the combination of mine supply constraints, smelter overcapacity, and accelerating demand from electrification and AI data centres. Electric vehicles, grid-scale transmission, and high-density compute infrastructure all rely on copper.
The unusual feature of this cycle is the simultaneity of high cathode prices and zero smelter profitability. In most cycles, high copper prices benefit smelters because by-product credits scale with copper revenue. This cycle, smelter margins have collapsed because they paid up for concentrate years ago and now compete with each other for shrinking supply.
Why LME Grade A cathode from non-China origins has become strategic
For Western cathode buyers — manufacturers of wire and cable, electric motors, transformers, busbars — the buying environment has changed in two ways:
Prompt cathode availability outside China has tightened. Chinese smelters consume their own output, plus rising imports of concentrate from any available origin. The pool of cathode physically located outside China and registered to LME has shrunk in relative terms.
Origin matters more than it used to. After the April 2024 LME ban on Russian-origin metal (see our August 2025 article on the one-year impact), non-Russian Grade A copper trades at a documented premium. Sanctioned-jurisdiction supply complicates the supply book of any large Western buyer.
Au Club’s LME Grade A copper cathode (99.99% Cu min) is sourced from Turkey and the UAE. Sarkuysan in Turkey produces LME-registered cathode at scale. Several UAE-based producers serve the Gulf and Asian markets. Both origins are clean from a sanctions perspective and from a sourcing-disclosure perspective.
1. Lock multi-year supply where possible. With cathode prices at record highs and forward curves in backwardation, the spot market is the worst place to be. Major Western consumers (cable manufacturers, electric motor producers) are signing 12-month, 24-month, and 36-month offtake agreements with Au Club and competitor traders. The premium for tenor is real but smaller than the spot volatility cost.
2. Diversify origin. A buyer with 100% supply from a single smelter is exposed to that smelter’s production disruptions, regulatory issues, and sanctions exposure. Aim for three or four origin relationships across two or three regions.
3. Negotiate premium structures. Cathode premium (the difference between physical price and LME) has widened. Codelco’s annual European premium for 2026 settled at multi-year highs. Premiums are not pure markup — they reflect physical scarcity. Engage on premium structure rather than just headline LME price.
Au Club’s offer
Au Club supplies LME Grade A copper cathode (99.99% Cu minimum) at 500-1,000 MT/month from Turkey and UAE producers. FOB terms. SGS or Intertek pre-shipment inspection. LC and TT payment. Full LME-registered brand documentation with each shipment.
For larger requirements (multi-year offtake agreements), the trading desk works directly with smelter relationships in Turkey, UAE, and selected European producers.
Looking ahead to 2027
The structural mismatch between Chinese smelter capacity and global concentrate supply is not resolving in 2026. New mine projects — Kamoa-Kakula expansions, Mongolian Oyu Tolgoi underground at full ramp, Indonesian copper from the Indonesian smelter build-out — will add supply in 2027-2028. But Chinese smelter capacity is also growing.
Two scenarios:
Base case. TC/RCs stay in single digits through 2026 and rise modestly in 2027 as new mine supply arrives. LME copper trades in a $11,000-14,000/MT range. Premiums remain elevated.
Bull case for buyers. A major Chinese smelter rationalisation. China has been signalling that it may consolidate or close inefficient smelter capacity. If 10-15% of Chinese smelter capacity exits the market, TC/RCs would normalise and physical premiums would compress.
For now, plan procurement around the base case.
FAQs
What is TC/RC?
Treatment Charge / Refining Charge — the fee a copper smelter charges a mine for processing concentrate into cathode. Quoted in dollars per metric ton of concentrate (TC) and cents per pound of payable copper (RC).
Why did TC/RC go to zero?
Chinese smelter capacity has expanded faster than global concentrate supply. Smelter competition for concentrate has bid TC/RC to zero — and in some spot transactions, to negative numbers.
Is cathode going to get more expensive?
The LME copper price has set successive records through 2025-2026. The structural drivers — electrification, AI data centres, mine supply constraints — suggest elevated prices through 2026 and likely 2027.
Where does Au Club source copper cathode?
LME Grade A from Turkey (Sarkuysan and others) and UAE producers. 500-1,000 MT/month availability. Non-Russian, non-sanctioned origin documentation with each shipment.
About Au Club
Au Club is a Dubai-based commodity trader supplying LME Grade A copper cathode (99.99% Cu minimum) from Turkey and the UAE. Multi-year supply structures available. SGS or Intertek inspection. LC and TT accepted. Contact our trading desk for current availability and pricing.